
Data quality cleaning using machine learning
New, more effective ways to avoid bad response effects, sampling bias and fluctuating KPIs
Some respondents click rapidly through the questionnaire, some erratically. The random sampling in a survey is often a far cry from a chance selection. Excessive quota systems increase the problem instead of solving it. Internal customers often ask themselves why an NPS (or other KPIs) has decreased or increased and can find no reasonable answer. Misgivings regarding the data quality can destroy the trust in an entire study. Luckily, there are new, effective ways to counter this.
The bad response effects example
Many market researchers have developed their own “practical” rules to counteract this. Overly short survey times or too many affirmations lead to the exclusion of a respondent. Occasionally, test questions are introduced to check whether a respondent is “paying attention”.
The problem is: what exactly is the right survey time that should be used to exclude respondents? Which rate of agreement can be used to differentiate a fan from a dishonest respondent? What exactly does the test question say about the survey behavior of the person?
The answer to this question is not known and can hardly be answered from data using typical means.
Self-learning analysis methods, also known by buzzword “machine learning,” offer the chance to learn of complex relationships between indicators and their effects based on data.
Bad response indicators include, for instance, the length of the interview, the response to a trick/consistency question, the number of identical responses in a row, and many more. The trick no longer tries to assume the meaning (= influence) of these indicators for the results (arbitrarily) but rather uses the data to discern the causal influence. This is possible with cause-effect analyses based on machine learning (especially NEUSREL). The analysis yields the following results. The graph shows that customer satisfaction is extremely high for interview lengths under a certain number of minutes (the scale is normalized to 100 here).
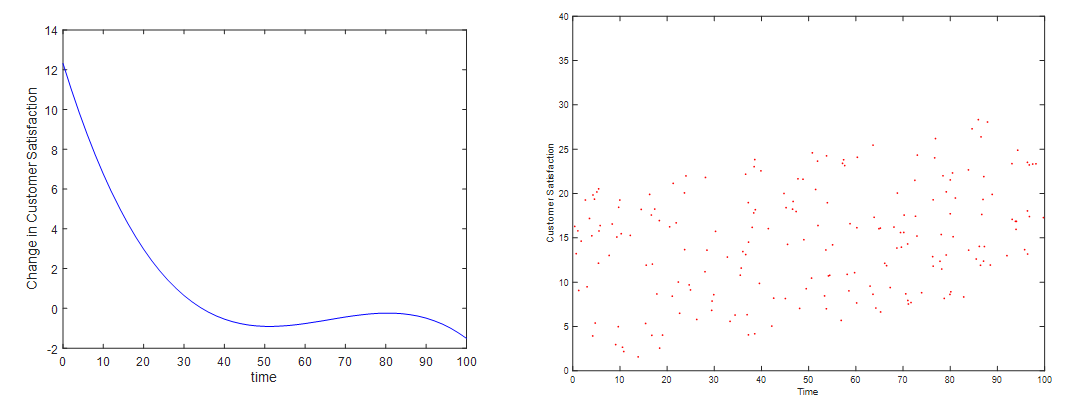
This makes it possible for us to derive reasonable decision rules. Below a time of 20 (normalized) the satisfaction is obviously massively biased. On the right side, you will find a scatter plot containing the same variables, and you see a very different relationship there. Why? It could be the case that the fast respondents are younger people who are per se less satisfied with the provider. Machine learning delivers causal, corrected insights instead of the typical spurious correlations.
If the data is used for a driver analysis, it is recommended to not exclude the suspicious cases at all. Because the bad responses are described well by the indicator variables, a driver analysis based on machine learning (especially NEUSREL) simply filters out the bad response effects. The sorting out of cases would introduce a new but unknown selection bias to data.
The sampling bias example
Distortions in random sampling can occur, for example, as a result of a willingness to participate among the subjects that does not differ randomly. By measuring indicators of this willingness to participate, such as age, sex, income or a trait such as the “need to communicate,” machine-learning-based cause-effect analyses can determine the relation between indicator and response behavior. If there are too many seniors in your sample, for instance, you then know how this will distort each question and consequently you can correct this effect.
For the use of data in driver analyses, it is sufficient to make good indicators part of the driver model, because it automatically subtracts out all bias effects. However, this is possible only for driver analyses based on machine learning (especially NEUSREL). In this manner, an overly strong quota system, which itself creates new quota-related biases, can be avoided.
p.s. More on NEUSREL and Universal Structural Modeling here2