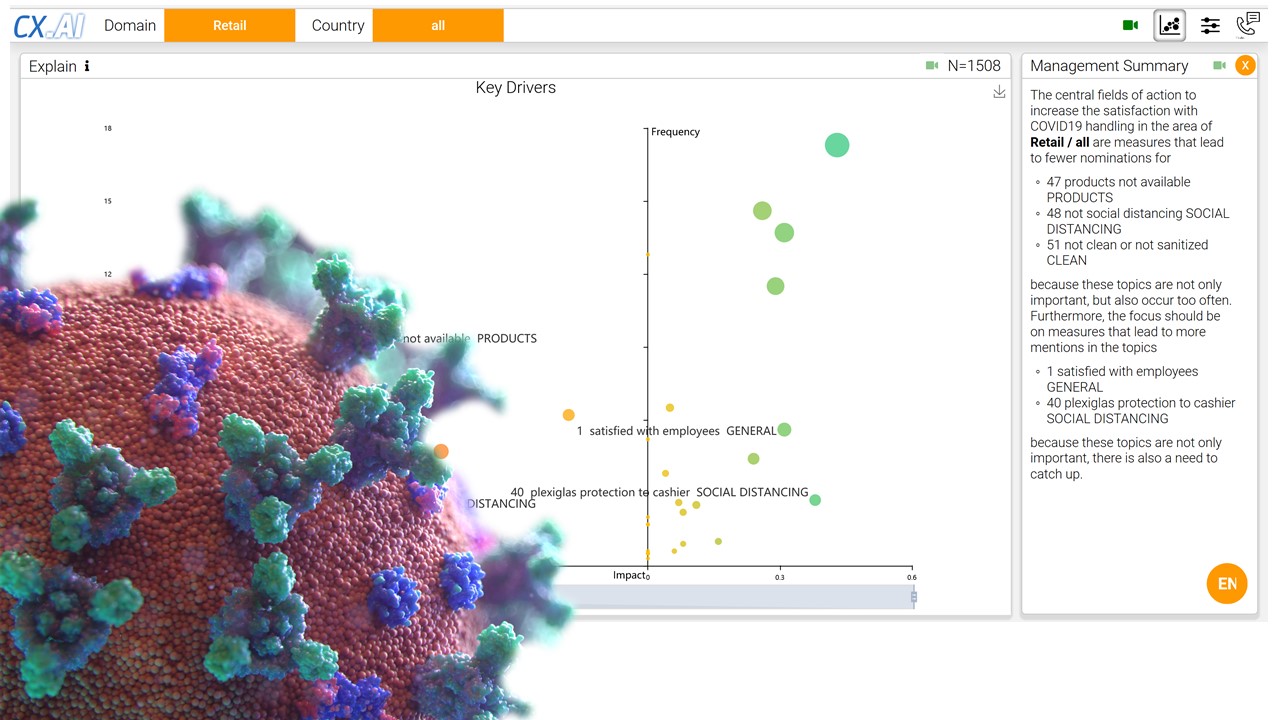
The actual study from Success Drivers – a German specialist for AI-powered insights – (supported by Europes leading Online Access Panel BILENDI) uncovers what retailers and online shops should do better right now. The study interviewed 3000 consumers in the USA, UK, and Germany and ask two simple questions. First, how satisfied the consumer is on how his retailer or online shop handles COVID19 and second, “why?”.
A two-stage artificial intelligence surfaces, what would stay hidden otherwise. For instance, is the plexiglass protection of cashiers a highly appreciated measure that is hardly applied by retailers.
Those results are even more surprising as most often mentioned themes are not necessarily the most impactful ones. Here a selection of other insights
Online shops are winning when securing supply. Make your efforts on this transparent.
The availability of products is a hygiene factor for retailers. Constantly empty shelves are made the customer very unhappy.
However “keeping the customer informed” as perception has no impact on satisfaction. Customers are bombarded with COVID19 messaging which mostly feels irrelevant.
What instead connect with customers is the human touch. They appreciate if the staff is going the extra mile for them and then feel closer connected to this particular store.
Interestingly, is that a few customers are very much worried about the workers of the online shops. Lousy management on this jeopardizes online shops’ reputation. A large part of this is a critique of Amazon.
Only 56% of retail customers and 53% of e-commerce customers are satisfied with how companies dealing with the virus.
Satisfaction is higher in Germany and the worst in the UK.
The study uses the technology of www.cx-ai.com – a service that exploits two-question customer experience surveys with unstructured customer text feedback. It first understands what has been said and then infers how relevant those themes are to drive outcomes.
New, more effective ways to avoid bad response effects, sampling bias and fluctuating KPIs
Some respondents click rapidly through the questionnaire, some erratically. The random sampling in a survey is often a far cry from a chance selection. Excessive quota systems increase the problem instead of solving it. Internal customers often ask themselves why an NPS (or other KPIs) has decreased or increased and can find no reasonable answer. Misgivings regarding the data quality can destroy the trust in an entire study. Luckily, there are new, effective ways to counter this.
The bad response effects example
Many market researchers have developed their own “practical” rules to counteract this. Overly short survey times or too many affirmations lead to the exclusion of a respondent. Occasionally, test questions are introduced to check whether a respondent is “paying attention”.
The problem is: what exactly is the right survey time that should be used to exclude respondents? Which rate of agreement can be used to differentiate a fan from a dishonest respondent? What exactly does the test question say about the survey behavior of the person?
The answer to this question is not known and can hardly be answered from data using typical means.
Self-learning analysis methods, also known by buzzword “machine learning,” offer the chance to learn of complex relationships between indicators and their effects based on data.
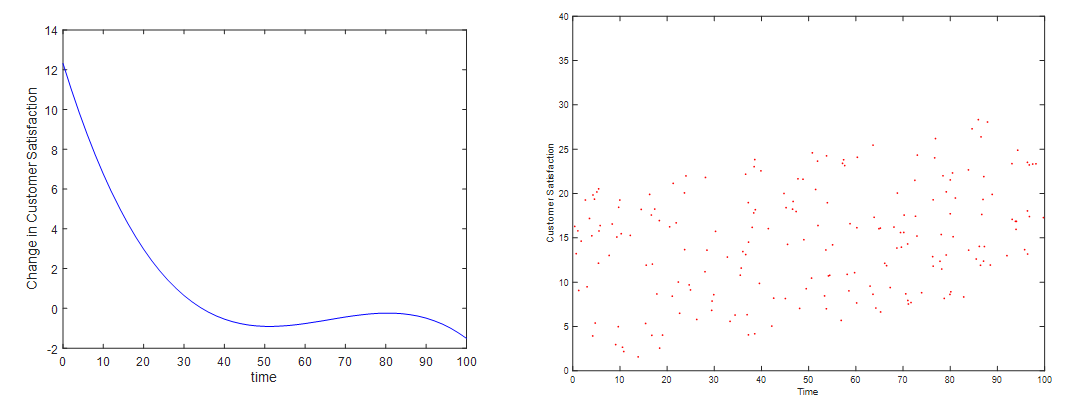
Bad response indicators include, for instance, the length of the interview, the response to a trick/consistency question, the number of identical responses in a row, and many more. The trick no longer tries to assume the meaning (= influence) of these indicators for the results (arbitrarily) but rather uses the data to discern the causal influence. This is possible with cause-effect analyses based on machine learning (especially NEUSREL). The analysis yields the following results. The graph shows that customer satisfaction is extremely high for interview lengths under a certain number of minutes (the scale is normalized to 100 here).
This makes it possible for us to derive reasonable decision rules. Below a time of 20 (normalized) the satisfaction is obviously massively biased. On the right side, you will find a scatter plot containing the same variables, and you see a very different relationship there. Why? It could be the case that the fast respondents are younger people who are per se less satisfied with the provider. Machine learning delivers causal, corrected insights instead of the typical spurious correlations.
If the data is used for a driver analysis, it is recommended to not exclude the suspicious cases at all. Because the bad responses are described well by the indicator variables, a driver analysis based on machine learning (especially NEUSREL) simply filters out the bad response effects. The sorting out of cases would introduce a new but unknown selection bias to data.
The sampling bias example
Distortions in random sampling can occur, for example, as a result of a willingness to participate among the subjects that does not differ randomly. By measuring indicators of this willingness to participate, such as age, sex, income or a trait such as the “need to communicate,” machine-learning-based cause-effect analyses can determine the relation between indicator and response behavior. If there are too many seniors in your sample, for instance, you then know how this will distort each question and consequently you can correct this effect.
For the use of data in driver analyses, it is sufficient to make good indicators part of the driver model, because it automatically subtracts out all bias effects. However, this is possible only for driver analyses based on machine learning (especially NEUSREL). In this manner, an overly strong quota system, which itself creates new quota-related biases, can be avoided.
What can marketing mix modeling do? What can’t it do, and what should you pay attention to when choosing methods and providers? We’ll go through the five most important questions that you should ask.
Marketing mix modeling arose from the realization that the simultaneous effects of individual marketing measures can’t be determined through descriptive data evaluation. Correlation coefficients or key indicator comparisons, “with vs. without measure X,” are inherently biased – this is the classic spurious correlation effect.
The regression analysis approach can help to determine which measures have which effect. In principle, they can do that. The effectiveness of the results is based on what the data set looks like and which methods of analysis you use. You should pose the following 5 questions before starting.
Can your Marketing Mix Modeling algorithm detect non-linear relationships and interactions between marketing channels?
Every marketing channel becomes saturated at some point. Further investment will not bear the same dividends as the initial investment. It is even often the case that after a certain point, additional expenditures can even have negative effects. This phenomenon is called non-linearities.
Furthermore, among media experts, it is almost general knowledge that marketing channels together have more of an effect than the sum of the individual effects. This phenomenon, which is used in management synergy, is called, “interactions” in statistical language. So, it’s surprising that most marketing mix models manage to get along completely without modeling these interactions.
Can your Marketing Mix Modeling algorithm find what is unknown up to this point?
In principle, with the help of econometric models, it has been possible to model non-linearity and interactions for a long time. The requirement is, however, that you have to know beforehand which non-linearities and interactions appear where. Then, the methods can determine its parameters.
Marketing mix models can have 100 variables. This means 10,000 possible interactions. On top of that, there are different kinds of interactions (AND, OR, XOR, etc.). That makes this especially time-consuming.
Furthermore, practical experience shows that the existing knowledge available is virtually never enough to stipulate the exact parameters for the econometric models.
That is precisely the large, practical advantage and the purpose of Universal Structural Modelling and NEUSREL. It doesn’t need any prior knowledge; it finds every arbitrary non-linearity and interaction independently. The result is a significantly higher explanation-power.
Do the Marketing Mix Modeling methods take indirect effects into account?
Regression and econometric models depict the relationship between driver variables and result variables. They measure direct effects exclusively, under the assumption that the drivers don’t mutually influence each other. An assumption which, in a digital age with many interactive touch points, can no longer be maintained.
In a marketing mix project for a mobile telecommunications provider, the Universal Structural Model and NEUSREL made it clear that after the television advertisement, people began to google the offer. This, in turn, led to significantly more Google AdWord clicks which, in turn, led to product sales.
TV is the driving cause. However, TV only had a very small direct effect on product sales. And this is only proven by regression analyses. Without taking the indirect effects into consideration, a very unrealistic view on TV’s effectiveness would arise.
Does your data set make the evaluation of long-term effects possible?
Marketing mix models count as methods that only measure short-term effects. The situation isn’t a question of analysis methods, but rather a question of the data used. Also, two steps also lead to making long-term effects measurable.
First, longer-term effects can be considered by using multiple target variables that differ on the time horizon. So, not only the sales numbers of the next weeks are used, but rather also those in 2 weeks, one month or even in 6 months.
Secondly, market research-based variables such as brand preference can be included as intermediate sizes in the model. These steps allow you to measure which influence marketing channels have on brand preference. Also, they allow you to measure which influence the changes in brand preference have on sales numbers. The key feature is that the increase of the brand strength is a short-term, intermediate effect. But it also has a long-term impact because it is proven that brand attitudes are long-term values. With this background knowledge, the long-term effects are realized over a horizon of 1 to 2 years.
Does the Marketing Mix Modeling method make the simultaneous visualization of all relevant channels possible in a given number of cases?
Marketing mix modeling was simpler a few years ago. There were TV, radio, print, and billboards. Today there is AdWords, thousands of types of online banners, online affiliate ads, pre-rolls, and so on. (More examples: game commercials, press releases, inbound telephone contacts, shop visits, video-based outdoor formats, website traffic, social media engagement, mobile ads, company events, sponsoring, product launch specials, competitions spendings, etc. etc. etc.)
When we assume that these dozens of channels influence each other in their effects and build synergies, it will make sense to integrate them all into one model.
The problem:
The more variables are incorporated into a model; the more data points are necessary to validly specify the model. At best, however, data are mostly used every week, which leads to data sets that have merely 50 to 100 data points. In this number of cases, regression approaches can only tabulate 5-10 variables sensibly – if you want to receive robust results.
We have implemented a technology in NEUSREL that has already been used very successfully in genetics, among other fields. Here, data sets are processed that have significantly more variables (=chromosomes) than data sets (=test subjects). This is possible thanks to a methodology trick. The method doesn’t try to explain an outcome variable anymore, but rather many target variables simultaneously.
Sales numbers in various sales channels are an example. All these outcome variables have common drivers and causes. The method compresses the driver variables into a few proxies (so-called components). The known Principle Components Analysis or Factor Analysis work differently. They create proxies that are in the position to account for the driver variables as far as possible. The new method creates the proxies in such a way that these can then optimally forecast the target variables. This is a fundamental and decisive difference.
The importance of the method is enormous. In the usual case numbers, it finally incorporates all of the relevant, influential factors. And this is precisely what delivers significantly more representative models. Additionally, there is a need to incorporate ever shorter timeframes into the analysis, especially when campaigns only run for a limited period.
Summarized …
the answer to these five questions gives the answer to which method should be used:
Can the method of analysis depict non-linear relationships and interactions between marketing channels?
Can the analysis methods of such non-linearities and interactions find what is unknown up to this point?
Do the analysis methods take indirect effects into account?
Does your data set make the evaluation of long-term effects possible?
Does the analysis method make possible the simultaneous visualization of all relevant channels in a few cases?
At the moment, there is only one methodology and one software that lives up to all the demands. It is the Universal Structure Modelling that is implemented in NEUSREL software.
Today, driver analyses are only used in a few application areas; however, they possess a much broader application potential.Let us shed light on where their use makes sense.
At the beginning, you should write down what your research goals are. Is your goal to gather facts or to just be able to picture the customer better? How much of the market share do we have? What does the customer think about us? How satisfied are the customers? How well will the new advertisement be remembered? In all of these cases, you don’t need a key driver analysis!
Often however, behind the search for facts, there is one fundamental question: What can I do to increase revenue, to make customers more satisfied or to make an advertisement more effective? Always then, when you would like to know which factors influence your goal, this is then no longer directly visible in the data. That is when you have to use driver analyses.
Apply driver analyses for all questions about causes and searches for most effective measures.
In a copy test, for example, you can measure the advertisement recall and ask the respondents what they thought of the ad. However, consumers are not in the position to honestly be able to explain the causes for their desires and actions, nor are they always willing to. No one will say to you, “Since the brand logo wasn’t faded in at the end, I can’t remember much about the advertisement.”
Driver analyses offer the solution. After a randomised commercial break, brand images and consumer acceptance is determined in a survey. Based on the data, the driver analysis can determine which effect an advertisement had on e.g. the brand image and consumer acceptance.
Without the right data, key driver analyses are only half as effective
With driver analyses, you learn what the advertisement triggers, changes and influences. With the right question items, precise indicators for improving the advertisement can be determined.
You are perhaps asking yourself, why e.g. respondents can’t simply just be compared: For example, the consumer acceptance of those who saw the ad vs. those who haven’t seen it. The answer is simple. They are not the same people. Both samples are always different.
The control group can include, for example, many people that already know and love the product. Their answers on consumer acceptance will turn out to be significantly different. The driver analysis tabulates all other influences (like, for example, if someone is already a customer) and can then determine the true effect.
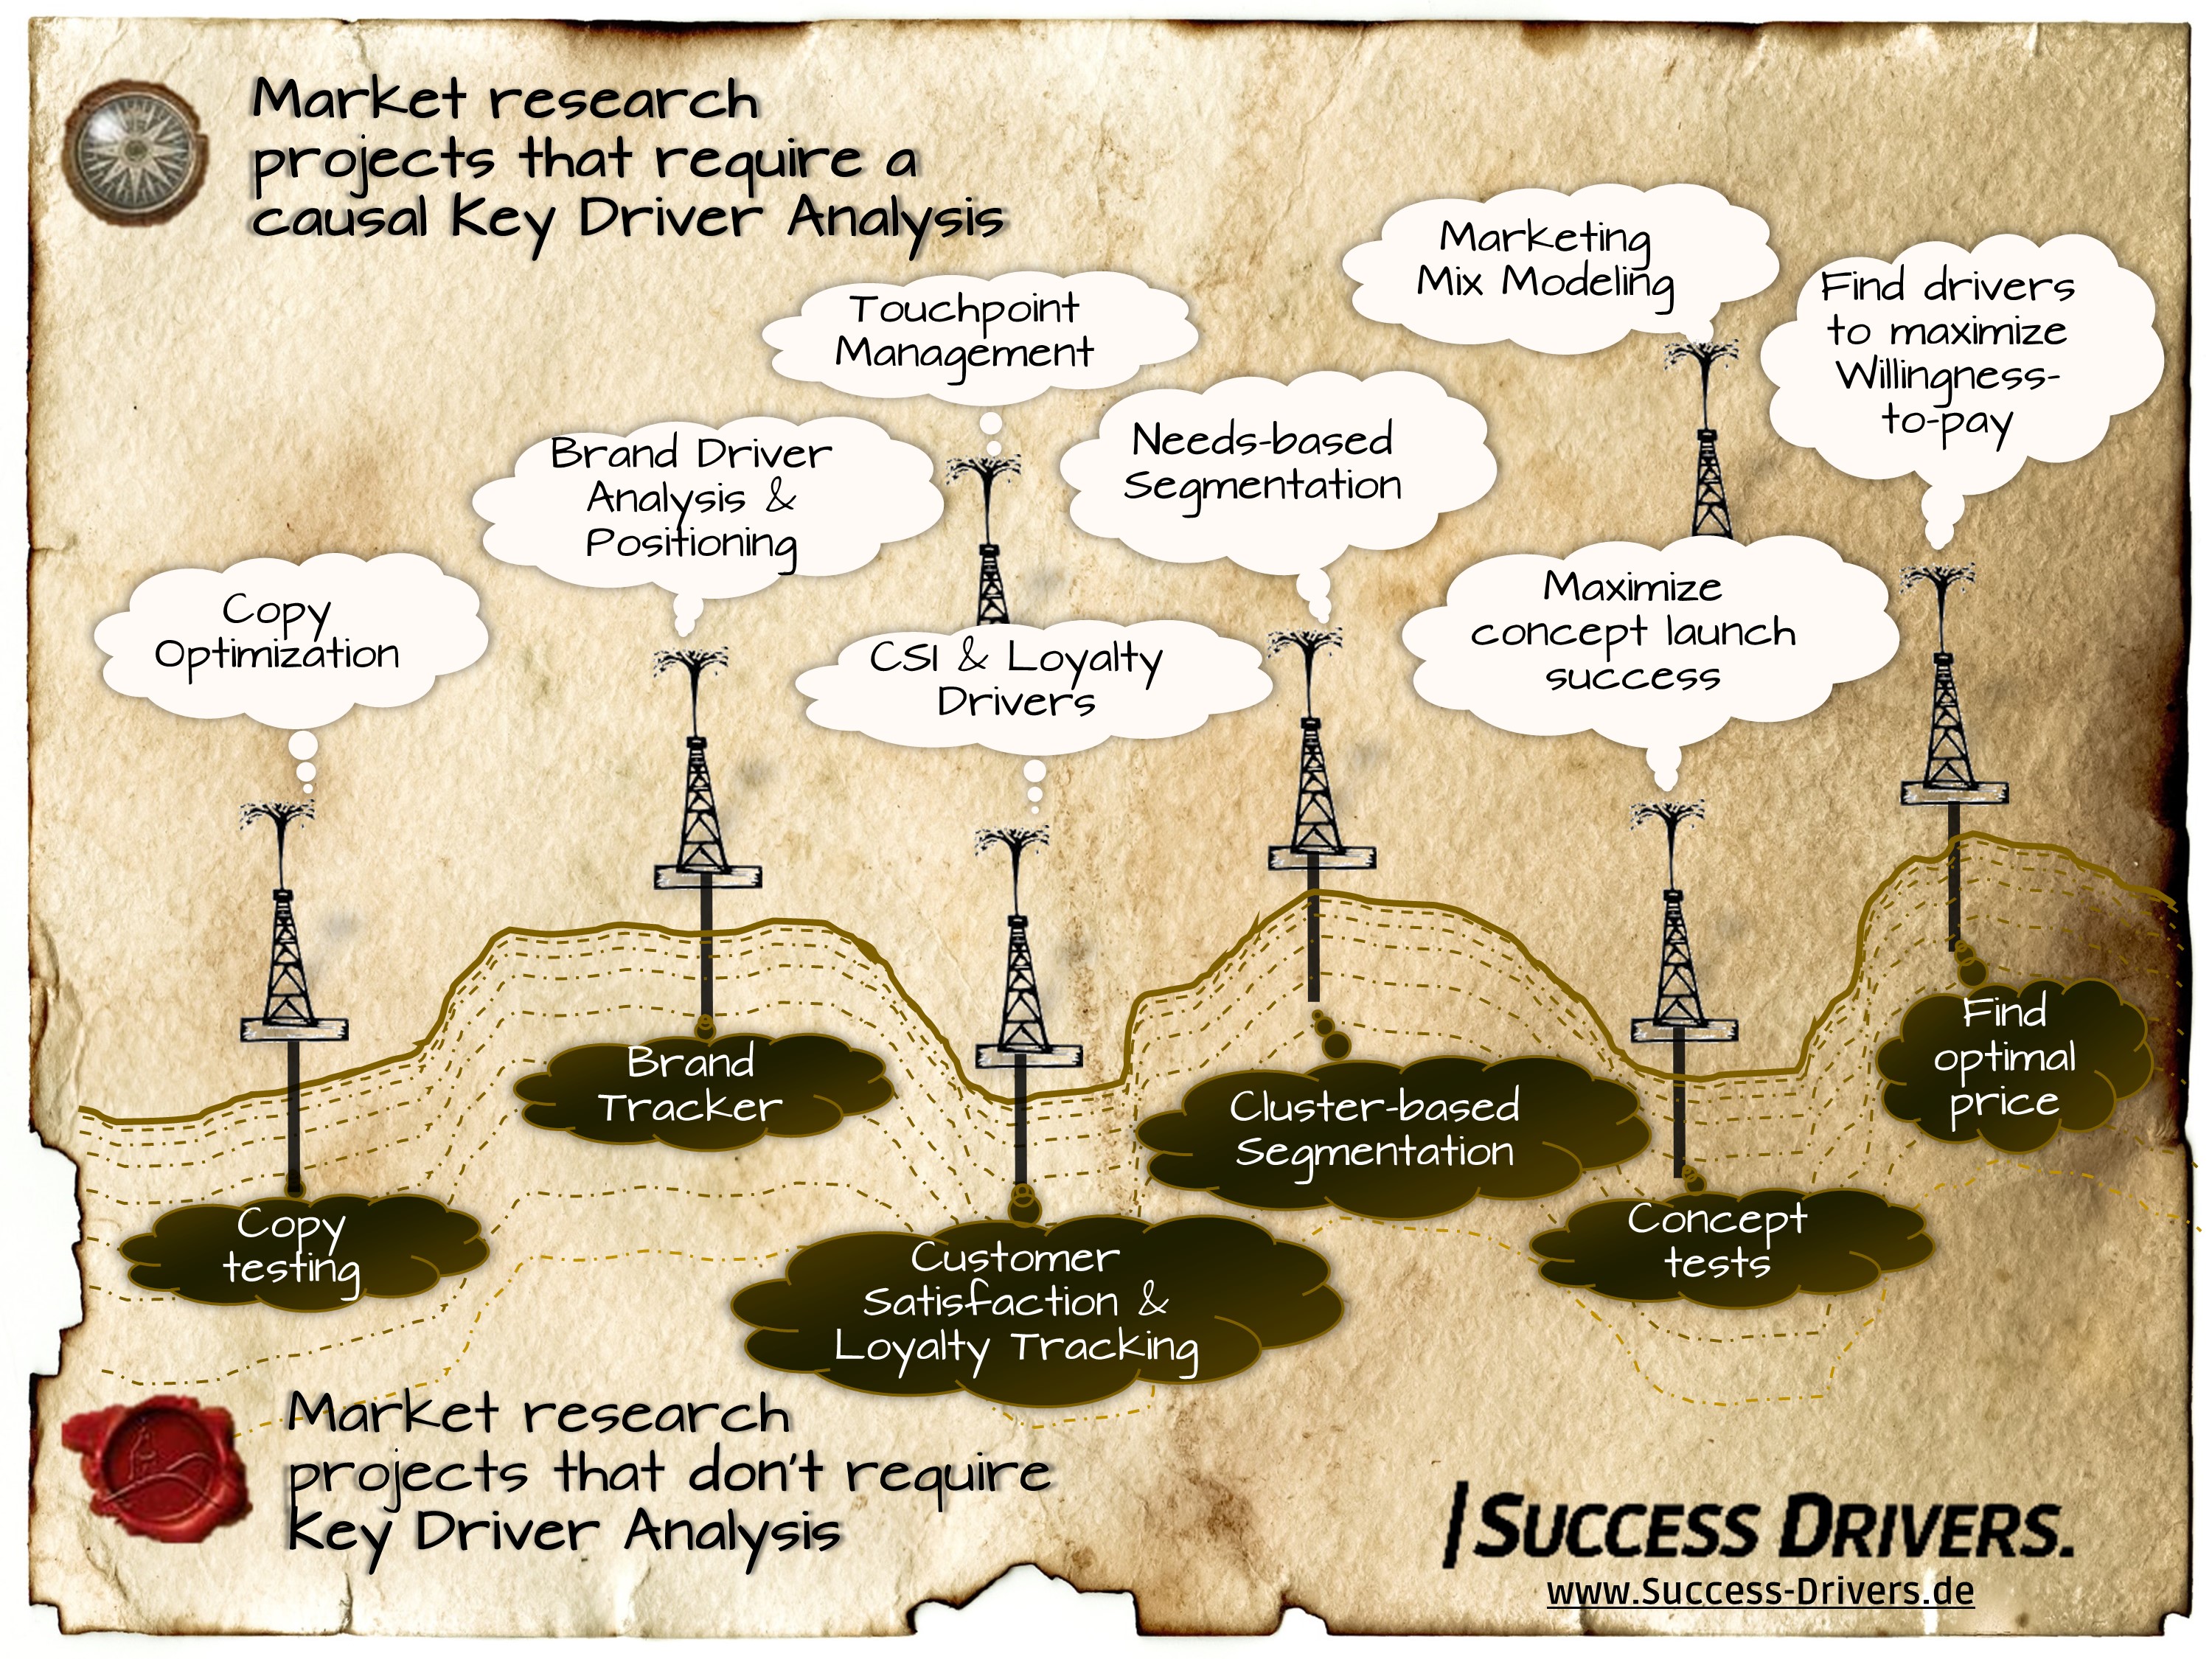
Every second market research project should use key driver analyses
If you go through the lists of the usual market research projects, you will notice that in almost all of them, the questions “why” and “what’s to do” arise. Be it copy tests, concept tests, customer satisfaction and loyalty studies, brand tracking, positioning and segmentation studies.
A question that’s puzzling at first:Aren‘t there many ways to find insights?Yes and no.There are various steps in the process and depending on the situation in which you find yourself, different methods are advisable.
Some things in life are simple. You try them out and, with experience, you notice what works and what doesn’t. Now in marketing and sales that approach doesn’t work anymore. Too many factors drive outcomes simultaneously. On top of this, actions need some time before they bear fruits. In the end, it is no longer possible to tell which actions had which influence – just from looking at the changes in measure of success.
What’s to do? (1) Trial and error is still the best way to find out if something works. Only you have to track all other relevant influences in order to subsequently be able to understand the exact effect of the measures taken. Sometimes however, testing is too risky or results in immense costs.
Under the assumption that one of the ways to fine-tune success isn’t controlled by a completely different background variable, the same findings can be read from the data sets even without experimenting. This is exactly what key driver analyses do.
Qualitative research is a necessary, preliminary step for quantitative key driver analyses
(2) The danger that your results are erroneous increases when the models aren’t complete and important drivers are missing. It is especially important to take into account the drivers that influence other drivers as well as the end results. Exactly for this reason, it’s essential to have a good, qualitative preliminary phase. The subject matter and the relevant factors have to be well understood.
Only the qualitative phase isn’t enough on its own. It is not appropriate for correctly assessing the importance of a cause. Time and again in qualitative projects, researchers gain the impression that they understood exactly the key factors for success.
However, studies show that for various reasons, this is almost never the case. Still, qualitative methods are capable to discover what could be important and this is always the first key step.
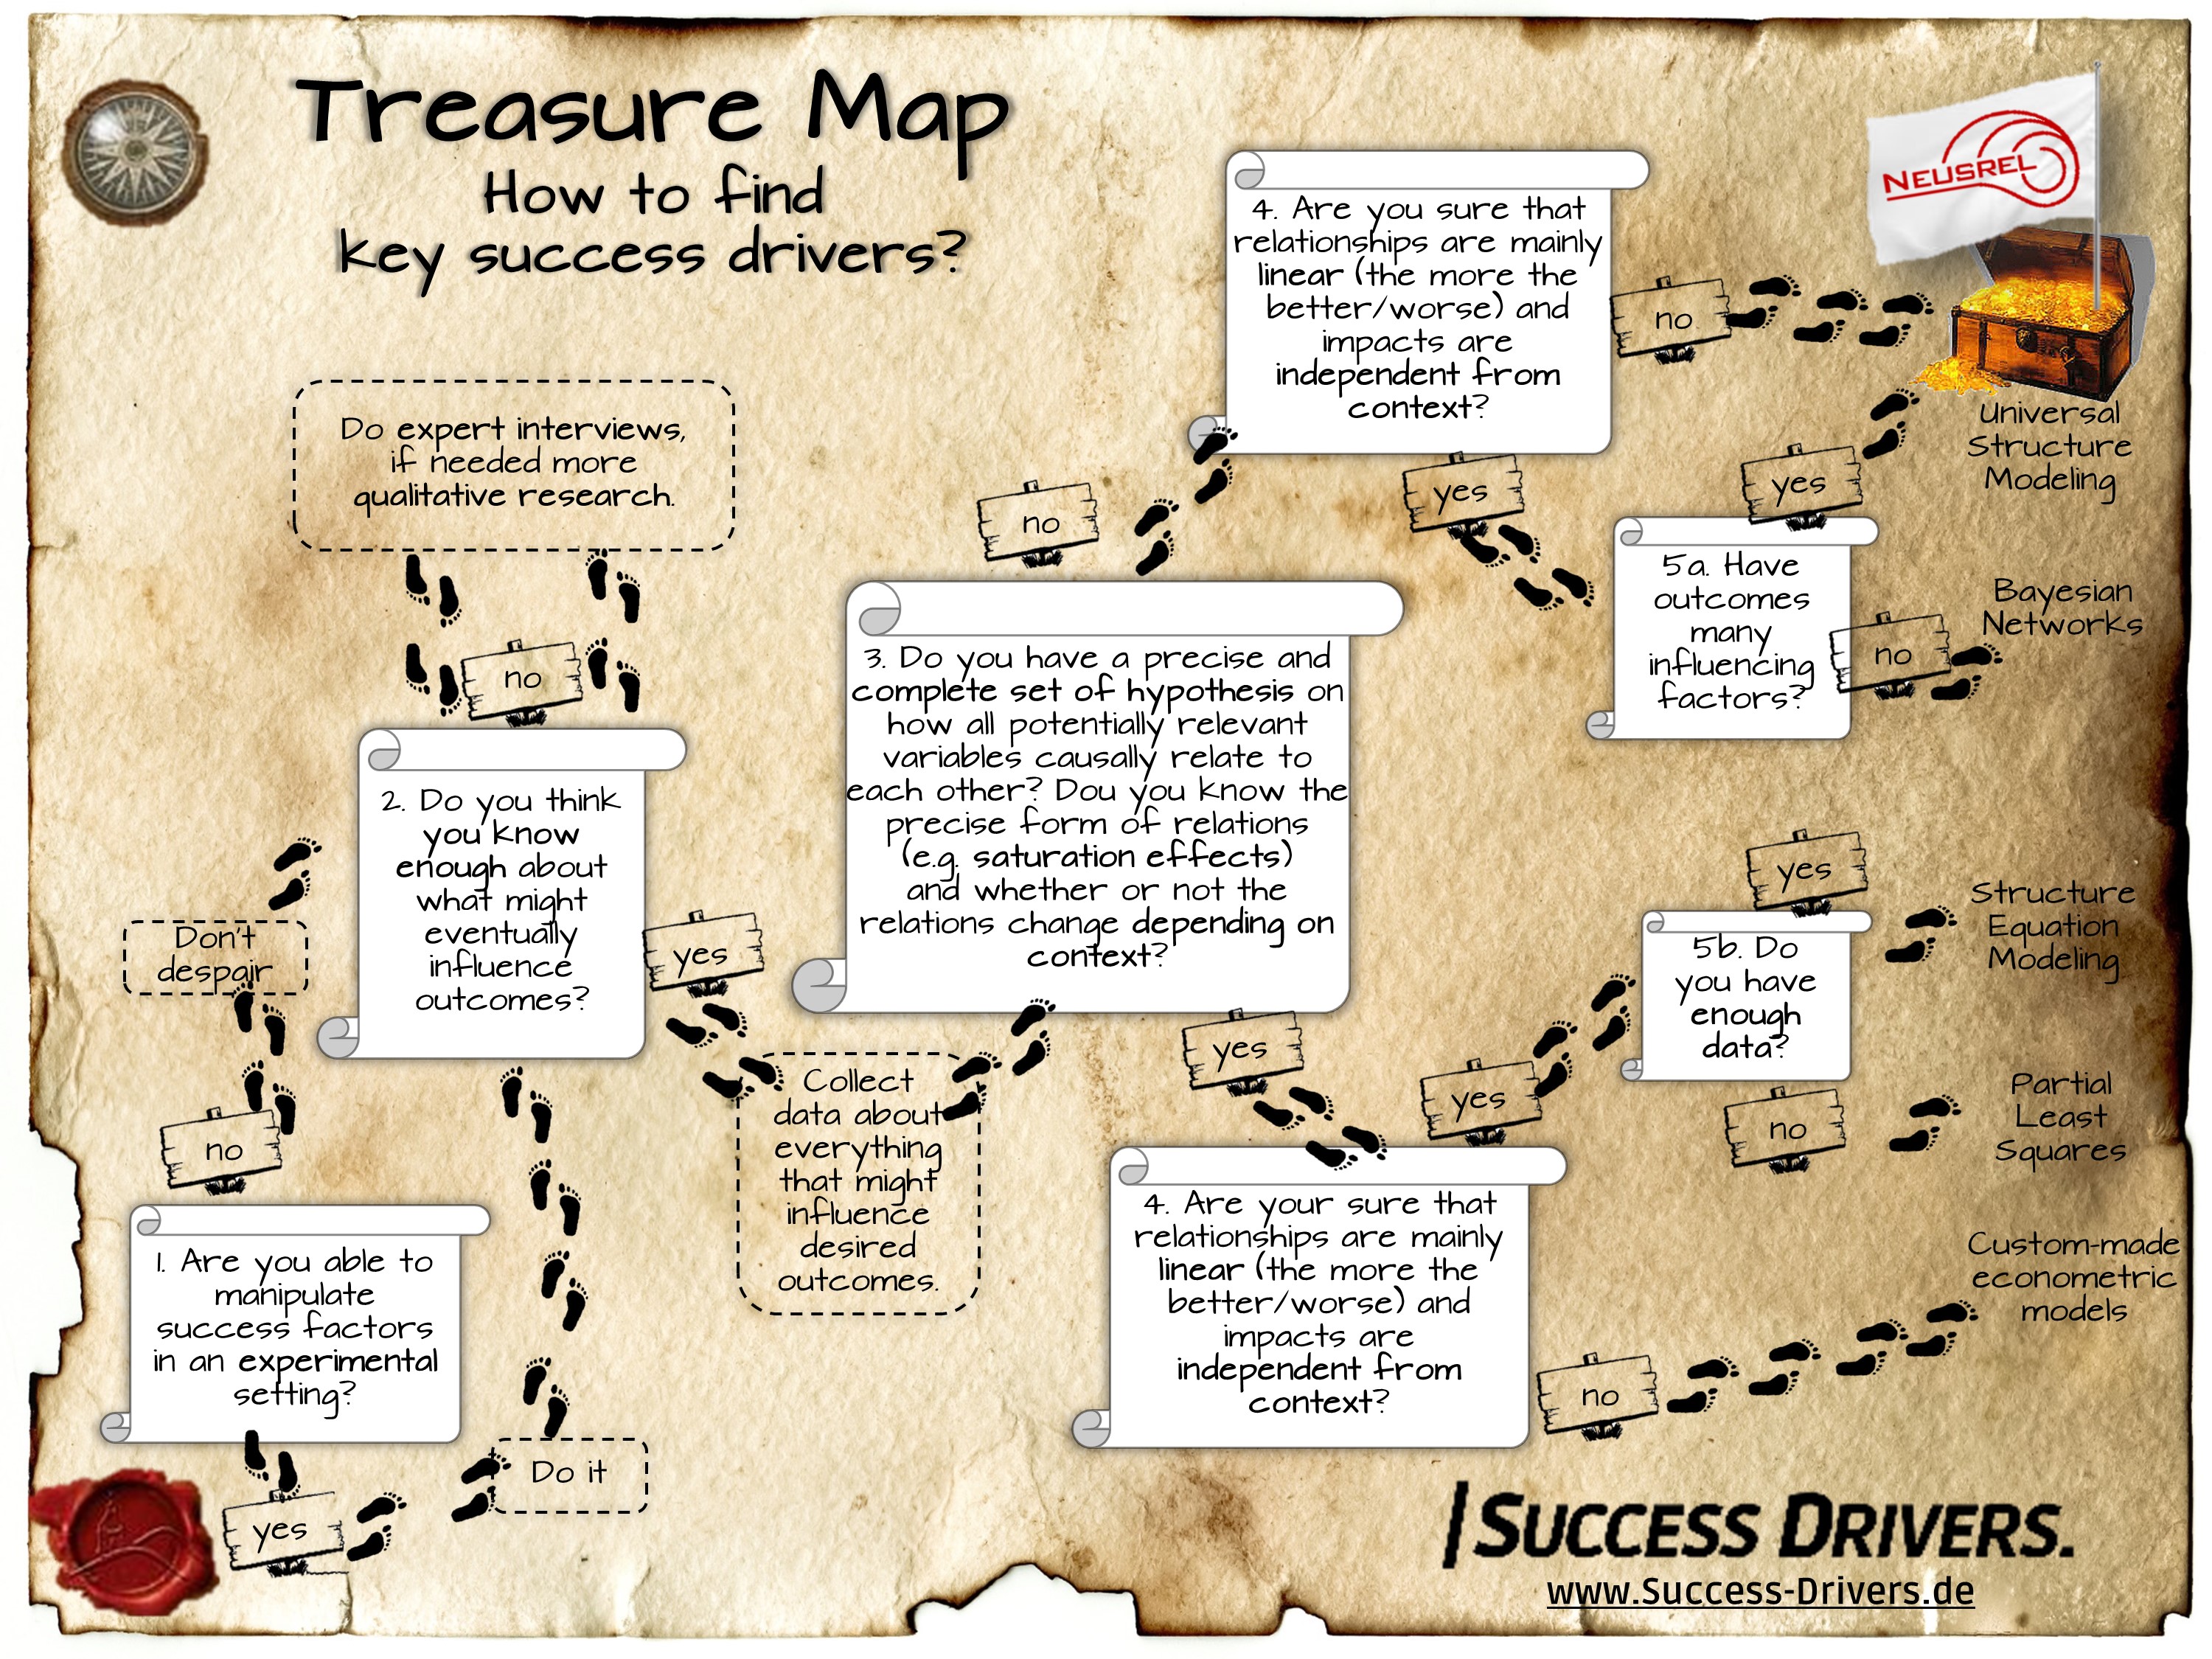
The fundamental question:Do you want to test hypotheses or discover new properties and relationships?
(3) Only now does the quantitative driver analysis come into play. The choice of the right method depends on the question: how much do you already know about the relationships between the variables? Do you know the principal relationships between the aspects and would you like to measure how strongly these assumed relationships actually are? Then it’s advisable to use either econometric models or the process of structure equation modelling.
If this isn’t the case, then you need explorative methods. (4a) If you are certain that it’s enough to accept linear relationships and to assume that drivers don’t contribute to their effect, then Bayesian Networks (also called “Directed Acyclic Graphs”) are a good choice, as long as outcomes don’t have a lot of possible direct key success factors.
(5a) However, according to our experience, all of these assumptions can hardly be justified in practice. In these cases, Universal Structural Modelling offers the flexibility, free from such assumptions, to be able to map how the relationships actually play out.
The approach is implemented and available in the NEUSREL software.
How leading returns researcher Professor Walsh discovered effective levers to lower the returns quota via causal analysis.
The extremely high returns rates in e-commerce are an unsolved problem – a problem that represents a challenge to managers due to the tight margins in online retailing. Traditional BI analysis results very often turned out to be misleading in the past. The reason is known as “spurious correlation”.
Success Drivers therefore identified, for example, that horizontal striped clothing was sent back less often. A classic spurious correlation: horizontal stripes are found particularly on cheap products, for which the returns rate is generally lower. Under otherwise similar circumstances, horizontal striped products are sent back MORE not less. This is a finding that can only be discovered via causal analysis.
The returns whisperer
For this very reason, Professor Walsh from the University of Jena has been involved in causal analysis with his team of researchers. His various studies provide many new insights into what drives product returns.
In a study, which appeared in the Harvard Business Manager, he and his co-invetigator found that the use of penalties and obstacles does not pay off in the long run. Their study showed a clear strategic path: return rates can be reduced by providing customers with relevant product-related information and making the buying process as hassle-free as possible. Virtual try-ons, avatars and specific product evaluations from peers are very helpful in this respect. The latter is a factor with very high ROI as the investment is low.
Self learning causal analytics covers up
With the current study the research team around Gianfranco Walsh were also able to identify a key driver of customer returns. Using consumer survey data and causal analysis, they found that the customer-related reputation of an online retailer alone has a significant effect on the return rates.
This reputation is determined by the following components: customer-orientation, being a good employer, being financially sound, perceived product quality and social responsibility. Although this measure may seem very abstract, the new causal model enables very precise measurement of the effect of bad press and to quantify the effects on the margin.
“There are also many company-specific returns levers. They may be identified most successfully via self-learning causal analysis – as enabled by the NEUSREL software”, Walsh recommends.
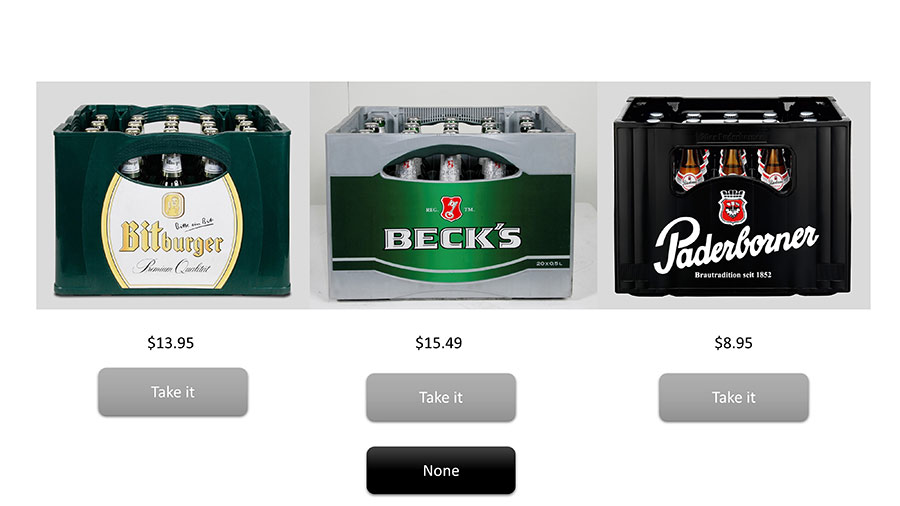
Conjoint Analysis: Price & Product Optimization Using Holistic Conjoint Analysis
It is an open secret in the industry. Conjoint Analysis Software often delivers strange results forcing analysts to tweak datasets or analytic parameters so that results will have some face validly. Only this is not a procedure that produces correct results. The phenomenon is a clear indicator that something is still wrong with today’s conjoint analysis approaches.
The challenge with Conjoint Analysis
Many advances to Conjoint Analysis approaches have been developed. There is ACA (Advanced Conjoint Analysis enabling for partial feature profiles), CBC (Choice Based Conjoint switching from preference to choice) or CSC (Constant Sum Conjoint enabling for a distributed choice).
The basic principle is to conduct several choice experiments by manipulating causes (i.e. features). Due to practical reasons, it is not possible to assess all possible feature combinations at one respondent. This is where the issue evolves. That is why the choice of feature combinations per person is randomized. This would work if samples were large enough, but they rarely are in real life studies!
An example clarifies
Imagine there is a study where actual consumers of a food brand are more likely to choose the brand – simply because they have already tried it. But this feature “have already tried” is not part of the conjoint experiment. If features are randomized, there will be features or feature combinations with significantly higher ratios of persons who have already tried the product.
Since they are much more likely to buy, conjoint analysis will “think” those features or feature combinations must be important. The problem is not solvable by quotation nor by other measures in advance because normaly we don´t know every “disturbing factor” in advance.
Why a solution of the Conjoint Analysis dilemma would be so valuable
If we could consider all the biasing factors of a conjoint, market researchers would enjoy several advantages:
First and foremost, it would very much increase the trust and confidence in the validity of results. You can be much more confident that derived recommendations will work.
An analysis with all relevant factors will enable a holistic view of the decision process. It will not just focus on the choice decision but will also quantify the impact of product features and prices towards brand reputation, brand awareness, consideration, loyalty or recommendation.
Finally, such a study would be a single source for multiple information needs. It may serve for brand positioning, segmentation and customer journey questions.
The powerful solution: Holistic Conjoint Analysis
For a holistic conjoint analysis approach we need to collect several pieces of information:
Several choice tasks per respondent with randomized feature profiles.
Attitudes and image of brand.
Data about the outcomes of interest, such as purchase intention, willingness to inform, brand consideration
Data about the respondents such as demographics, their situation, and their history. Are they already customers? Are they bargain seekers? Are they familiar with the costs? All those items that might have an impact on their desired outcomes.
The ultimate question is ‘how do we identify which changes would improve the outcome?’ It is a challenge to conventional methods as they are built to fit parameters of a known model.
What is needed is a method that builds a prior unknown model in light of data, a model that incorporates indirect causal effects and does not neglect nonlinearity or interaction of those unknown relationships. This is exactly the strength of the Universal Structure Modeling approach that is performed by the NEUSRELTM Software.
The good news: Holistic Conjoint Analysis is proven, reliable, tried and tested
We compared dozens of studies on the validity of Holistic vs. Conventional Conjoint and found a validity lift of 25 to 85% in explanation power. Results show typically higher face validity and give seamless recommendation where pricing and product configuration naturally fit to positioning, segmentation and marketing strategy advice, as it is derived from one single data source and one single causal model.
Marketers and market researchers who are hoping to find the most effective actions in data are confronted with dozens of statistical methods.
At some point someone started to rename regression-based techniques as “key driver analysis” in order make it more obvious what they do – figuring out what drives success. However this has not been ‘state-of-the art’ for decades. Companies can prevent expensive mistakes by switching from Key Driver Analysis towards Causal Analysis. Read Why!
The challenge with Key Driver Analysis
Key Driver Analysis has been a major step, helping to guide companies away from spurious correlations and dangerous mistakes. In fact, the term mainly describes regression analysis or similar econometric techniques and comes with its limitations.
Inflexible
Regression techniques estimate parameters of a model which represents the impact of certain factors towards an outcome. Within this model, it is assumed that factors are independent. This means that the parameter is always the same no matter what the situation.
E.g. a bottle of water leads to a certain growth of a tree, no matter how much water it already had and whether or not the tree gets enough sun.As the example shows, these assumptions can be very unrealistic. The techniques are not able to adopt assumptions to data and mostly don’t even consider the nonlinear nature of reality.
Only direct Effects
On top of this, regression techniques live in a simple world: factors influence outcomes – full stop. When a TV campaign drives Google Adword Views and those clicks then drive sales, a regression method would give the “TV factor” a small impact parameter because with Google Adwords can perfectly explain sales.
In most real life cases, factors influence each other, just as TV drives Adwords. If you do not consider this, you are not measuring the full impact but only the direct impact.
Key Driver Analysis is simply outdated. UNILEVER first applied it in the 1920’s. It has been around for nearly a century! Companies need a methodologic upgrade to be able to compete in the 21st century.
Why a solution of Key Driver Analysis’ challenges would be so valuable
If we could only quantify the full, and not just the direct, impact, if we could model data with a self-learning system that finds realistic but unknown features such as saturation effect or moderating factors… we would be able to understand much more realistically what drives success or why customers choose a brand.
More importantly: We would no longer be forced to impose unrealistic assumptions or badly founded hypotheses. We would have more effective recommendations and sales and marketing actions. Increased advertising effectiveness will help save millions of marketing dollars.
The powerful solution: Advanced Causal Analysis
The roots of causal analysis are a hundred years old as well. It all started with experimental test designs. As well as the fact that many things in business are much too expensive to test, most real life experiments face another issue:
there are other drivers of outcome that cannot be perfectly controlled (e.g. with a perfectly randomized sample). That is why a kind of “Key Driver Analysis” is needed to quantify the impact of factors including the experimental action.
The classic causal analysis
In the 1960s and 70s, regression had been extended to path modeling techniques (Structure Equation Modeling SEM, Partial Least Squares PLS) which are modeling not just direct, but the full effect of causes.
Later in the 1990s, Baysian nets (or Direct Acyclic Graphs) had been developed which, on top of SEM and PLS, can (in simple networks) identify the causal direction between variables out of data.
The age of Machine Learning
All those methods have a common limitation: they are not self-learning systems, as researchers are forced to assume a fixed model – most of the time, they also need to assume linearity and independents of factors (remember the tree example!).
The Universal Structure Modeling approach implemented in the NEUSREL software changed that in 2008. As conventional causal analysis requires making assumptions that nobody can justify in a business context, USM is a true breakthrough for practical applications.
The good news: Advanced Causal Analysis is proven, reliable, tried and tested
Since 2008, there have been hundreds of business projects conducted with the help of Advanced Causal Analysis, Universal Structure Modeling and NEUSREL. Many reputed scientists have approved the methodology, dozens of papers have been published and highly reputed brands such as Audi, Deutsche Bank, L’Oréal, P&G, Unilever and many more are leveraging these techniques.
These companies understand up to 300 percent better why customers do what they do. They gain insight that was previously unknown. They explore nonlinearities and discover saturation effects and optimas in their data. They learn how factors and conditions interact and how target groups naturally divide into segments. They learn it without knowing or hypothesizing about it beforehand. This enables these companies to step on a learning curve never seen before.
Dozens of studies have been shown that about 70% of advertising impacts cannot be reasoned by how much you spend nor which media mix you have chosen. Rather it is all about crafting an effective creative. But how do we craft an effective advertisement? It is only about 30% art but 70% hard science. This article highlights a proven Copy-Test-based method that ensures creatives that drive Advertising Effectiveness.
The Challenge with Copy Testing
Copy testing of advertisements is a common practice. Still the majority of campaigns don’t meet expectations. What’s wrong? Many interesting research methods have been added to the copy test toolbox in recent years. Eye tracking, skin resistance checks, Neuromarketing with EEG and fMRT measurement, facial emotion coding and Implicit Reaction Testing (IRT) are all powerful methods to detect to what target customer might think and feel about an ad.
But something is missing here
But something is missing: When trying to interpret one of those measurements you assume that you know how this measure relates to the outcomes you tries to influence. This is not the case. There is no single measure that will give success. Furthermore, how components interact with each other might be different per segment, product or situation.
Advertising can be stimulating but there are products where this characteristic is false. So far all surveys are built on the assumption how the measures are connected with the actual target.
Why a solution of the Copy Testing dilemma would be so valuable
If we could decode the hidden formula that enables us to predict outcomes like purchase intention or brand consideration using copy test data, we would be able to optimize the creative in a way that outcomes are maximized.
We would be able to write an individual manual of do’s and don’t’s for every brand on how to craft advertising. Such a manual would be our crash barrier on the creative road of advertising effectiveness.
The powerful solution: Copy Testing based on Causal Analysis
In a model-based copy testing approach, we need collect several information during a copy test:
Data about the direct impression of a copy test – newer measurement approaches like IRT and facial coding can play a vital role here.
Data about how the direct impression changes attitudes towards the brand and how it increases recall and recognition of the ad.
Data about the outcomes of interest, such as purchase intention, willingness to inform, brand consideration
Data about the respondent like demographics, their situation and history. Are they already customers? Are they a bargain seekers? Do they know prices well? All those items that might have impact on their desired outcomes.
The ultimate question is: how do we identify which changes would improve outcomes? It is a challenge to conventional methods as they are built to fit parameters of a known model.
What is needed is a method that builds a prior unknown model in the light a data, a model that incorporates indirect causal effects and do not neglect nonlinearity and interaction of those unknown relationships. This is exactly the strength of the Universal Structure Modeling approach that is performed by the NEUSRELTM Software.
The good news: Copy Testing based on Causal Analysis is proven, reliable, tried-and-tested
Results of model-based copy-testing has proven to be eye-opening of marketers and gives an unbiased rigorous guidance: A recent study has looked at a TV spot of a beverage. The spot made a great impression; everyone liked it, only it did not do anything with consumers. We found that the spot was evoking nonproductive emotions and needed to switch from balance to stimulating emotions.
We found that the spot missed brand anchoring during the advertisement and especially at its end to leverage recall. The optimized spot broke all records and has become the best performing advertisement in the brands in history.
Some say, similar recommendation could have been produced by alternative approached. This big and fundamental difference to any other approach is: We know and have statistically proven that our recommendations are the main levers to maximizing market outcomes. Are other approaches able of the same? We replace “hope” with “knowing” with our selflearning causal analysis.
An automobile manufacturer encountered the Pareto phenomenon: A small number of the customers are responsible for a large part of the earnings. In practice, it is often not easy at all to be able to recognize what a customer possesses in terms offuture value. On top of this question arises how to capture this value. To find an answer you need to think through the whole process of marketing and sales to its logical end. This is exactly what the automobile manufacturer did.
Step 1: In the rearview mirror, you don’t see the upcoming curve: a future-oriented calculation of customer value
Customer-value-oriented customer management is only in its rudimentary stages among automobile manufacturers. Sure, there are corporate customers and there are customers who buy the expensive types of cars.
But what will they buy in the future? How loyal are they to the brands and to the authorized dealers? How probable is it that their next car will be a new car? How much business will be a result of personal recommendations? How much business in service and accessories will the customer trigger? These are central questions to which, up until today, there aren’t any satisfactory answers…no: weren’t!
A research panel of customers delivered the basis for the data: customer profile data, personal car purchases, precise quarterly service expenditures. An additional survey among this panel delivered the information necessary to understand the sales triggered by personal recommendations and to also understand sales expectations over the long-term.
Predictive Analytics (here NEUSREL) delivers the mathematical formulas that can calculate, from customer profiles, the diverse, future revenues to be expected. The result: a forward-looking customer value for every customer, which is calculated based on a small set of variables from that customer.
Step 2: What to do with the valuable customers? Derive segment-oriented support concepts from the data.
“What to do?” The customer value tells you how much value can be “gambled away” when you don’t pay attention. It doesn’t tell you what you can do in order to retain the value or increase it. Here is where Predictive Analytics can help too. Because approaches like NEUSREL also deliver the importance of the variables. And these tells you what the driving force of substantial customer value is.
The automobile manufacturer found out, for example, that aficionados of high performance cars not only invest significantly more today and in the future in production, but also most notably in service. A substantial maintenance division that takes care of high performance cars was born.
Furthermore, the company found out that brand loyalty and trust explained almost half of the customer’s value. The segment of the emotionally uncommitted provides a segment that can be excited by measures tailored to individual customers. Their affiliation can be tested with just two “killer questions.”
Step 3: Does the customer respond to my actions? More effective guidance through prognostic Action Scores.
It is a decisive step when realizing which buttons you can push on a target customer. Nevertheless, it can happen that the chosen measures don’t take effect. Perhaps because the person, per se, doesn’t read any emails or advertising letters or maybe isn’t receptive to any discount offers.
What you need is an assessment of whether the call, the letter or, for example, the discount offer will actually evoke a positive reaction. In this way, you can avoid having your marketing and sales investments end up in your customer’s “spam folder” and their effect going up in smoke. You don’t want to run the risk of putting your customers off.
How does that work? The targeting, with the help of Predictive Analytics, is a practice that has already been successfully used in direct mailing for over 20 years. On the basis of customer characteristics and customer reactions from the past, an Action Score can be calculated, which provides a probability of a customer’s reaction to a certain measure. With the help of Action Scores, the automobile manufacturer increased the effect of the measures taken by 84% – with the same investment.
Step 4: Change is the only constant: the necessity of a control process
What about when the planned measures are new and therefore there aren’t any empirical values available? Then you need a pilot phase for these measures. For this, customers will be addressed randomly. After a few weeks, a Predictive Model can be built and the measures can be efficiently guided based on the Action Scores.
The value of a customer will also change over time, just like their needs and the products of your company. That’s why the automobile manufacturer decided to conceive the issue as a control process. The customer value formulas are regularly calculated anew. Different than the conventional segmentation approach, the needs segments are also regularly reexamined and, as necessary, adjusted and brought to life with Action Scores.