Category

Allgemein

Use Customers Gut Instinct to Forecast Demand NOW!

By | Allgemein

Use Customers Gut Instinct to Forecast Demand NOW!

Demand dropped by large for many enterprises. Other businesses just went into survival mode to by on the “save“ side. My observation is that business now tend to assume the worst. Of cause that’s an exercise needed to protect liquidity and let it survive.

But surviving short-term does not equal survival midterm. To survive mid and long-term, you need to be objective. You to size challenges if they are present. Size demand as it comes back. Understand changing customer needs fast.

In other words, flight-mode “on sight” is only viable when you are moving slow enough. So slow that you can get out of the way when a obstacle appears. Now, the speed of your journey is not in your hands. You need a fog light. The stronger the better.

Which fog lights do companies using?

  1. They look at China

China is 6 to 8 weeks ahead, depending where you are at the global. Many companies observer where they are and how demand evolves.

Clearly the approach has its merits. Still it only looks 6-8 week ahead. It assumes things are same in other reasons. Also it assumes that western worlds is similarly successful to fight the virus as China.

  1. They take Lehman Crisis as comparison

Companies take the rear view mirror and compare how long it took 2007/2008 that demand came back. This however is an even more odd comparison. The underlying reason for the recession had been quite different.

  1. Use Data Science for Forecasting

Some companies use data science to predict order income. We at Success Drivers also implemented such systems. Actually the demand forecast e.g. in automotive are pretty impressive. In automotive we calibrated everything at a 3 month horizon. Social and search figures show good predictive power towards short-term demand.

But predictive models -no matter if machine learning powered or not- work only in the boundaries of the known data ranges. A demand drop of 50% have never been witnessed in the data at hand. That’s why those models are quite unreliable right now.


Embracing the Customers Gut

Conventional forecasting approaches are not enough for todays “fog”. But there is a well know method that can complement the existing toolset: Explore customers gut instinct!

Think election polls. There is a poll method call “prediction market” that is collecting the gut feeling and collective wisdom. This method is amazingly accurate in predicting real poll outcomes. Its proven in hundreds of scientific publications.

Lets say you need a car. When someone ask you whether you will buy a car you may say “Yes”. But in economic uncertainty your gut may hesitating to buy. This gut instinct is a great predictor. It summarizes all you know about the future in one readymade feeling.

Tapping on this feeling can help to bring your forecasting to the next level. Is it a crystal ball? Its not as some unpredictable political circumstances may intervene.

Still it is the BEST forecast we can make. It is the BEST information we can base our decisions on. It is the BEST fog light enabling us to drive faster than ever.

How does it work?

When you ask someone a question and then put him under time pressure, people tend to react instinctively. When you then measure to the time needed t answer you have a measure how intuitive the answer has been. That’s the rational of a well-researched psychological instrument called Implicit Association Test.

It is so powerful that it can even reveal hidden, unsaid prejudices against race or sex. We compared implicit predictions with real market dynamics and found it amazingly precise.

Try it by yourself. Its easy to get started and a pilot is affordable to any enterprise.

Think about it 😉

Frank

p.s. if you are in doubt, send me an email to Buckler@success-drivers.com

How Retail & E-Commerce Needs to Manage COVID19, Now.

By | Allgemein

Cologne, April 7, 2020

The actual study from Success Drivers – a German specialist for AI-powered insights – (supported by Europes leading Online Access Panel BILENDI) uncovers what retailers and online shops should do better right now. The study interviewed 3000 consumers in the USA, UK, and Germany and ask two simple questions. First, how satisfied the consumer is on how his retailer or online shop handles COVID19 and second, “why?”.

A two-stage artificial intelligence surfaces, what would stay hidden otherwise. For instance, is the plexiglass protection of cashiers a highly appreciated measure that is hardly applied by retailers.

Those results are even more surprising as most often mentioned themes are not necessarily the most impactful ones. Here a selection of other insights

  • Online shops are winning when securing supply. Make your efforts on this transparent.
  • The availability of products is a hygiene factor for retailers. Constantly empty shelves are made the customer very unhappy.
  • However “keeping the customer informed” as perception has no impact on satisfaction. Customers are bombarded with COVID19 messaging which mostly feels irrelevant.
  • What instead connect with customers is the human touch. They appreciate if the staff is going the extra mile for them and then feel closer connected to this particular store.
  • Interestingly, is that a few customers are very much worried about the workers of the online shops. Lousy management on this jeopardizes online shops’ reputation. A large part of this is a critique of Amazon.
  • Only 56% of retail customers and 53% of e-commerce customers are satisfied with how companies dealing with the virus.
  • Satisfaction is higher in Germany and the worst in the UK.

More insights are freely accessible in a public dashboard at www.success-drivers.com/corona-access

The study uses the technology of www.cx-ai.com – a service that exploits two-question customer experience surveys with unstructured customer text feedback. It first understands what has been said and then infers how relevant those themes are to drive outcomes.

Reach out to Frank Buckler for more

Buckler@Success-Drivers.com

3 Ways to Cut Insights Costs with Artificial Intelligence

By | Allgemein

3 Ways to Cut Insights Costs with Artificial Intelligence

The virus puts huge pressure on worlds economy. Most businesses will face unknow challenges. What to do?

Stop any expenditure? Maybe – if you have a liquidity issue. Saving costs – certainly if your budgets had been cut. Hear my personal top 3.


  1. Replace long item-based CX and Brand Trackers with CX.AI

Still some companies maintain bulky surveys with lots of closed ended questions. Responds rates are decreasing but tracker costs are quite remarkable.

A new research approach now make more from less. All it needs are two simple questions. A rating (on satisfaction or consideration or whatever outcome you track) and an open text field on WHY.

A now automatically categorizes the text feedback in human level quality. A second (causal) AI, then makes sense out of the data and identifies mostly hidden success drivers.

Suddenly a 1-minute survey can reduce cost, level up speed and help the business with crucial insights. Insight that are not descriptive but prescriptive.


  1. Save Qual-Studies by Merging Qual with Quant in Concept/Idea Testing with CX.AI

When it come to saving costs, insight manager tend to scale down and do qual only. This is actually very dangerous. Qual is an important first stage, but too often it is confused with true empirical evidence. Too often they produces nice stories and explanation that will turn out to be wrong.

The new research approach now enables for the opposite route. Get rid of your qual phase and get your qualitative input thru open-ends. An active listening tool like www.Probe-AI.com puts a digital psychologist into your survey.

With the new approach you get unaided qualitative insights and at the same time you prove out the predictive power of the hypothesis your respondents come up with.


  1. Reduce Sample Size with Score.AI

If God wants there will be in June the ESOMAR Client Summit in beautiful San Francisco. Dr Jain from Microsoft will present our joint work on the challenge to get more stable CX scores with less data.

Microsoft is leveraging AI to first selectively invite clients only when they are more likely to respond. Second, they use AI the find pattern across the globe to reproduce which CX score are particular area or segment should most probably have.

With this stability of smaller cuts are boosted by large and at the same time the number of sent outs as well as responses can be reduced.

More with less. No magic. Just AI.


Whatever you do to navigate thru this exceptional times. Use the challenge to raise like phenix from the ash after all this turmoil. We’ll do the same.

If you think your phenix will need one of the three approaches to fly better…

…lets talk.


Frank

(write me at Buckler@Success-Drivers.com)

The 36 Days Customer LOVE Challenge!

By | Allgemein

The 36 Days Customer LOVE Challenge!

It is all about how you make your customers fall in LOVE with you…(and your brand 😉). I will not provide recipes because there are no templates for YOUR customer’s success.

Instead, I will inspire. The inspiration that will lead you to think how important it is to listen, to understand, to read between the lines, to draw the right conclusions, and to be able to act on it.

This challenge takes 36 business days – Monday to Friday.

Why 36?

Professor Arthur Aron of the University of New York conducted experience where two strangers ask each other 36 predefined questions. After the study, an unexpectedly large amount of participants became couples and married. Statistically, the method dramatically increases the likelihood of falling in love.

In this challenge, I will make you fall in love with me and my mission: The mission to free business decision making from the curse of spurious correlations and false assumptions, from correlation-prone fact-based management and blind hypothesis-driven analytics.

In this, I will answer the 36 questions, and I will encourage you to do the same (in metaphoric terms) to do the same with your customers.

Are you in?

Frank

p.s. you want to learn more about my mission?

…and the mission of the whole Success Drivers Group? Ok, then follow me:

The best introduction to this gives my last book, “The End of the KPI Illusion”. Leave your email in the form below, and I’ll send you the eBook free of charge.

Enter Corporate Email here*

The core of the issue is a simplistic understanding of fact-based management. This understanding is taught in business schools today. “What you can measure you can manage” is a big misunderstanding. Sure, without data, no managed improvement possible. But data alone is just noise. Jumping from data to conclusions is similarly effective as management by gut-feeling.

Why? Because correlation is not causation. Even comparing two KPIs is also a kind of correlation analysis. But this is 99% of fact-based decision making is built on.

The way we make a decision based on data must be set from head to its feet. We need to acknowledge what we need to make decisions: EVERY decision is based on causal assumptions. “If I do X, then Y will happen”. What we need to make a better decision is NOT better data. It actually can not be even measured. It is hidden BEHIND data.

That’s why its crystal clear what we need: a practical and actionable causal analysis framework. Conventional statistics do not provide a toolset that has the properties businesses need in many ways. This is why we developed a causal analysis methodology based on machine learning (Causal-AI).

Amazing case studies like this from T-Mobile are the best proof for its vast power. Who wouldn’t want to double the revenue at record profits enabled by a simple AI-powered insight?

The Next-Level are AI-Solutions Not Just Tools.

The next level, however, are our latest efforts to package the technology into ready-to-use solution bundles.

CX.AI ends the widespread wastage of customer feedback data. It’s AI codes text like a human and then uncovers CX drivers like a “genius”.

CX.AI leverages data that every enterprise already has. It helps to make fast, impactful business decisions. In an easy, simplified process, all analysis results are accessibly in an interactive dashboard.

More about CX.AI is at this website www.cx-ai.com. If you leave your email here, we will send you our Mini-Pocket-Book free of charge “6 Simple Steps to Drive Instantly 4X Impact on CX”.

Enter Corporate Email here*

The 36 Days Customer LOVE Challenge!

It is all about how you make your customers fall in LOVE with you…(and your brand 😉). I will not provide recipes because there are no templates for YOUR customer’s success.

Instead, I will inspire. The inspiration that will lead you to think how important it is to listen, to understand, to read between the lines, to draw the right conclusions, and to be able to act on it.

In this challenge, I will make you fall in love with me and my mission: The mission to free business decision making from the curse of spurious correlations and false assumptions, from correlation-prone fact-based management and blind hypothesis-driven analytics.

Do you want to learn more about my mission?

The best introduction to this gives my last book, “The End of the KPI Illusion”. Leave your email in the form below, and I’ll send you the eBook free of charge.

Enter Corporate Email here*

The core of the issue is a simplistic understanding of fact-based management. This understanding is taught in business schools today. “What you can measure you can manage” is a big misunderstanding. Sure, without data, no managed improvement possible. But data alone is just noise. Jumping from data to conclusions is similarly effective as management by gut-feeling.

Why? Because correlation is not causation. Even comparing two KPIs is also a kind of correlation analysis. But this is 99% of fact-based decision making is built on.

The way we make a decision based on data must be set from head to its feet. We need to acknowledge what we need to make decisions: EVERY decision is based on causal assumptions. “If I do X, then Y will happen”. What we need to make a better decision is NOT better data. It actually can not be even measured. It is hidden BEHIND data.

That’s why its crystal clear what we need: a practical and actionable causal analysis framework. Conventional statistics do not provide a toolset that has the properties businesses need in many ways. This is why we developed a causal analysis methodology based on machine learning (Causal-AI).

Amazing case studies like this from T-Mobile are the best proof for its vast power. Who wouldn’t want to double the revenue at record profits enabled by a simple AI-powered insight?

The Next-Level are AI-Solutions Not Just Tools.

The next level, however, are our latest efforts to package the technology into ready-to-use solution bundles.

CX.AI ends the widespread wastage of customer feedback data. It’s AI codes text like a human and then uncovers CX drivers like a “genius”.

CX.AI leverages data that every enterprise already has. It helps to make fast, impactful business decisions. In an easy, simplified process, all analysis results are accessibly in an interactive dashboard.

More about CX.AI is at this website www.cx-ai.com. If you leave your email here, we will send you our Mini-Pocket-Book free of charge “6 Simple Steps to Drive Instantly 4X Impact on CX”.

Enter Corporate Email here*

1

THE Inconvenient Truth About Business Success – Discovered by AI Analytic

By | Allgemein

THE Inconvenient Truth About Business Success – Discovered by AI Analytic

Focus on the one thing. Don’t get lost with too many things. Won’t you agree? Things are not distributed evenly: neither the value of customers nor the importance of key success drivers. The well-known “Pareto effect” told us for decades that with 20 percent of actions we can achieve 80% of success.

So far so good. But everyone who tried to put this philosophy into action realized that it’s easier said than done. It starts with a serious challenge: which ARE those key actions that hold the largest lever for success? It requires a quest to find causal key success drivers. To me it is sad to realize how seldom proven techniques to determine those drivers are applied for business. This is true independent from size and financial power of a corporation. Still, this will not be our focus here.

I want to stress another point that I realized over many years of causal success drivers research for business: It’s not enough to find and pick the one or two most important levers.

Why? The concept of success drivers assumes that any of them produces its impacts independently. I like to illustrate this with three examples. Applications where the disastrous impact of the “independency assumption” become most obvious.

Discovered by AI Analytics #1: The Miracle about New Product Launch Success

Launching new products is taught. 95% of products do not survive the first two years. How is this possible? Numbers suggest that nearly all marketing departments are “just incompetent”. Why is it so hard to launch an ordinary consumer product? Decades or centuries of experience lay behind us. Why can’t we learn over time and just fix the mistakes?

At Success Drivers we were lucky to get some precious data sets into our data hungry fingers: All over 20 thousand new Consumer Packed Goods launched in a particular year together with its sales per week, distribution rate, price, category, hundreds of coded package properties, and data from a consumer assessment survey. This survey measures how consumers perceive a new product and how they believe they (or someone else) will buy this product.

The devastating fact: Neither the consumers intention to buy – nor the prediction that other consumers will buy- are correlating with success. So does any other factor in the quite holistic dataset. The owner of the data set asked us for help as he failed to explain success with conventional statistical modeling. The result of the following modeling project resulted in a true Eureka Moment – an insight that led to a chain of observation culminating into this article.

Long story short. It is not the purchase intention, the brand power, trustworthiness, price-worthiness, uniqueness of the design, distribution rate or the right price level. Nothing of this alone is the key winning factor to focus on for success. It is all together!

Yes. The evidence is clear. The model that gave rise to this insights is capable of detecting a winning product with 80% likelihood before it is even launched. It found that 95% of new products fail not because brand managers fail to focus on the right tasks. They fail because they do not manage a success chain of factors.

Its even more astonishing that this insight is so intuitively right. Why intuitively right? If you have a great product which is heavily overpriced it will not fly – no matter how cool it looks, correct? If you have a fantastic product at the right price but you do not manage to convince enough store to put it into their shelfs, it will not fly either. All those factors are NOT independent from each other. They multiply in their effect.

If you generate five random columns of numbers and multiply them, the distribution of this product looks exactly like the sales figure distribution of newly launch products. 5% make it, 95% suck. This is for a reason.

We need to think “Success Chains”. The weakest link determines success. For new products its distribution, brand, right price, agreeable product features and a product that is good enough so that consumers will buy again. A tediously management of this success chain as a whole will multiply brands new product launch ROI.

Discovered by AI Analytics #2: The Secret of Effective Media Campaigns

Established brands are on the constant quest to improve media spends effectiveness. Since 1919 (!) when Unilever pioneered the use of Marketing Mix Modeling, the approaching are constantly improving. The approach leverages statistical methods to understand the mutual impact of each marketing channel onto sales. But for “whatever” reason those models need to be recalibrated every other months or quarter. If e.g. TV is the most effective channel, why should it change significantly month by month?

All those marketing mix models from the big modeling agencies I have seen so far miss several critical factors. Most models do not consider brand power. Although it is an open secret that most ads do not sell the next day. They build brand that embraces its power when demand arises or the consumer finds himself in front of a snacks shelf. The mere effect is indirect and long-term not short-term as most marketing mix models are setup.

But the biggest flaw is something else. A recent “Ground Truth” project from the American Research Foundation again validated that about 75% of marketing impact is not about spending the right amount of dollar at the right channels. It is about curating the creative content in a way it sticks. The quality of advertising is largely determining the ROI of marketing dollars.

This means, what marketing mix model measure is mostly the result of the quality of brands advertising compared to the quality of competitive advertising. This is why models need to be recalibrated as they do not measure and include the qualitative side of the spend.

Again. Its not about finding the most effective marketing channels. It is about managing a success chain that is optimizing creative content and finding a mix that maximizes reach within the group of potential customers. Only if both is well managed at one point in time, success will be likely.

Discovered by AI Analytics #3: The Unsolved Challenge of Creative Optimization

What makes an advertising successful? Ask 10 creative directors and you get 11 profound answers. Luckily there is marketing science and well elaborated copy testing techniques. We just need to test creatives and know how they will perform. Really? All larger brands test their ads. Still most ads do not meet expectations and do not generate measurable growth. Most ads are burning money.

The reason? Marketing executives rely on the wrong KPIs and the belief that a strong KPI #1 can substitute for a weaker KPI #2.

Example. Most marketing researchers belief an ad needs to “cut the clutter”. This is why unaided awareness of an ad becomes the ultimate success indicator. This belief is widely spread, although research experiments shows that even sponsoring banners can be very effective although they are nearly ever consciously noticed.

2017 we conducted a large syndicated copytesting study and leveraged AI to unveil the DNA of successful advertising. We embarked on a copytesting approach that not only measures things like learning, ad-brand-linkage or liking but also the intuitive emotional reaction after seeing an ad. The results surfaced again a “success chain”-property.

This is what we found: For every ad it is mandatory to leave its audience happy. Happiness is an indicator of relevance. Its very useful but not mandatory to surprise. But it is mandatory to avoid feelings like anger, disgust or contempt at all times. The interesting thing now is that its not just about emotions. In many categories it is important that the message sticks. But the emotions are the driving factor to make an ad memorable and the message rememberable. It’s not about rational or emotional marketing. It needs to come together. There exists a creative success chain.

Identify Your Success Chain

Things are more complicated than we would like them to be. Success factors are notoriously interdependent.  It is not enough to focus on the presumed key drivers. It’s mandatory to identify key success factors. But then the success chain need to be considered and managed at the same time.

Like a tree needs water and sun to grow. If you don’t have water, more sun will just do more harm than good. It’s the same in the business world. Data scientists call this phenomenon “interaction of factors” or “moderator effects”. The challenge is that conventional data modeling fall flat when hitting on unknown interactions (as well as nonlinearities). This is the moment of truth for Machine Learning and Artificial Intelligence. Those techniques are built to find any kind of interactions as long as there is enough data.

This fascinating capability enabled our Causal AI platform to uncover the phenomenon’s described above. It showed us that there is still a lot to learn and that decision making in our Machine Learning age should be augmented with AI in order to stay on top of the game.

Audit the AI analytics potential of your enterprise

You are a decision maker or influencer for insights driven decision making in an enterprise (>5000 employees)? Then you qualified for a free consultation with Success Drivers founder and CEO, Dr. Frank Buckler. This is a pure, one-on-one Q&A session between you and him, with a single goal: to provide you more clarity how you and your company can practically find and exploit its success chain.

Just send Frank an email (buckler@success-drivers.com) and he will try to find time for you as soon as it is possible for him.

# # #

How to create a truly enjoyable survey …

By | Allgemein

How to create a truly enjoyable survey… 

and why this is the key to get deeper and more actionable insights.

Do you remember those hot days in the summer of 2018? At one of those days, we were about to launch a mobile survey with 16 questions, 8 of them being open-ended. My colleague David, who were sweating next to me, said “This will never work! Who wants to respond to 8 open-ended question, on a mobile phone?”. Still, we had no other choice. We even added two more questions, “did you enjoyed this survey?” and “why did you answered this way?”

The outcome was a surprise. On average, about 50% of respondents in conventional surveys indicate they enjoyed the survey. Our mobile survey achieved a 91% enjoyment rate. Wow!

You will ask yourself “why?”. This is exactly what we asked the respondents. The most frequently mentioned reasons were “it was easy”, “these were good questions” and “it was fast”. (actually, the average time was 5 minutes, which is a rather long response period on a mobile phone).

Are you satisfied with these answers? We took them to the test. If a reason is a true reason, it must be possible to use its information to better predict the enjoyment rating (in a multivariate model). This is a ground-truth formulated by the fathers of causality research such as Nobel Prize winner Clive Granger.

This is why we build a flexible (machine learning based) prediction model and discover something quite exciting. None of the frequently mentioned reasons predicts well why respondents enjoyed the survey. Instead, two other reasons are highly predictive.

The text response “the survey was simple” was mentioned by 10% of respondents and was a strong predictor of survey enjoyment. Further, text that can be summarized as “i liked the opportunity to describe my sentiments with my own words” was mentioned by 9% and is an even stronger predictor.

Recent attempts to increase respondents’ engagement in the industry typically circle around varied and entertaining ways of surveying and to use more gamification approaches. But what we now learned is that the key is less about building more sophisticated ways of asking, it is more about to keep it really simple and give respondents the option to communicate in the most authentic way possible: to use their own words.

You may ask “ok, but is coding open-text responses economically even feasible and attractive?” Recent technologies that combine Natural Language Processing and Machine Learning can automatically code large volume of text. The system we use must be trained by a human coder. Then its output has comparable predictive power with human codings.

“Ok, but what does this mean for improving the quality of insights?” you might ask yourself…. good question!

Let’s look at what we have learned. We have learned that we receive the most authentic and high quality information from respondents (e.g. your customers) by asking very simple questions and let people respond in their own words. At the same time, we now have the technology to discover hidden drivers of success in those simple text responses.

Of course, we can not only learn what is truly enjoyable with surveys, we also can learn why customers are loyal or more likely to recommend your brand. We can also learn why they consider certain brands or choose a new product innovation.

We can learn valuable insights that are key to success by using extremely simple and cost effective research methods. What could be more exciting?

If you like to dive deeper … e.g. how to make this work for your NPS program, your Brand Tracking study or whatever you think drives value in your company, just let me know and I’ll be happy to chat.

Yours, Frank

Why customer join, is not why they stay: Artificial intelligence reveals the key loyalty drivers for mobile provider

By | Allgemein

Why customer join, is not why they stay: Artificial intelligence reveals the key loyalty drivers for mobile provider 

Mobile customers may choose a carrier because of a proper connectivity. Interestingly this reason is not the most important for their loyalty and why customers recommend their carrier to others. Instead, the key driver of customer loyalty and recommendations are attractive plans. This is a core finding from Success Drivers’ recent category CX study.

The results exemplify the power of the company’s solutions to reveal hidden drivers of customer loyalty. Two research instruments, CX.AI and Brand.AI use two simple sources of information: a standardized scale to measure customer loyalty and an open text question asking “why?”. The study was done in collaboration with codit.co – an AI-powered platform for the analysis of open-ended survey questions.

“We asked 1,000 American customers: “Would you recommend your mobile carrier to a friend”. And we asked “why?” They most frequently answered “because of the good network connectivity/coverage” said Frank Buckler, CEO of Success Drivers and continues: “What we discovered is that this reason – although most mentioned – has a minor impact on customers loyalty and recommendations.”

The Success Drivers AI technology revealed the factors that were more likely to lead to carrier loyalty and recommendations. Although connectivity/coverage is known to be the one of the dominant factors why customers choose a carrier, it has only moderate impact on loyalty and recommendations. AI algorithms found that being satisfied with the actual plan is the largest reason why customers stay at a carrier and the dissatisfaction with their plan is the major reason for leaving.

The methodologies used in this study rely on coding text into content categories. The research tool is an AI-powered platform, which automatically codes text with great precision after training by human content experts. Its novel deep-learning-based engine enables fast, inexpensive and accurate analysis of large-scale open-end surveys or other text sources.

The figure below shows a more detailed picture of this study. The vertical axis is the frequency with which a loyalty factor has been mentioned, and the horizontal axis shows the impact of factors on customer loyalty. The results show the challenge of conventional survey research: customers find it difficulty in prioritizing what drives their behavior. Self-learning AI-based algorithms help finding the complex correlations between customer responses and their level of loyalty and likelihood to recommend.

CX.AI: A simpler CX platform with deeper insights

Conventional CX programs are descriptive, not predictive. They do not provide insights into why NPS score has changed or reveal the hidden, non-obvious success drivers. CX.AI’ powerful web-based dashboard shows it all: Trended NPS, our proprietary AI-powered impact of key loyalty drivers, and an explanation of the change in NPS compared with the last wave.

Established high-reputation brands like SONOS are convinced: The NPS.AI solution helps to simplify, and safe costs, and most importantly it delivers insights capable to inform top-level business decisions.

More details: https://www.cx-ai.com

Why Good Sex is not enough: Artificial Intelligence reveals the key drivers of a happy relationship

By | Allgemein

Why Good Sex is not enough: Artificial Intelligence reveals the key drivers of a happy relationship 

We just released a study that explored the hidden drivers of relationship satisfaction. The results exemplify the power of the Success Drivers solutions to reveal hidden customer loyalty and brand consideration drivers using two simple questions: a scale to measure satisfaction and an open text field asking “why.” The study was done in collaboration with caplena.com – an AI-powered platform for analysis of open ended survey questions.

We asked spouses or partners why they are satisfied or dissatisfied with their relationship. They most frequently mentioned “joint activities” and “lack of cooperation”. What we discovered is that those reasons have a minor impact on their relationship satisfaction.

The Success Drivers AI technology revealed the factors that were more likely to lead to fulfilled relationships. Physical affection is important and prevents the leading reason for dissatisfaction (after cheating) in a relationship. However, our AI algorithm found that physical affection is a necessary, but insufficient condition for relationship satisfaction. Importantly, happy relationships are associated with higher reports of good communication among partners and unexpected helping behaviors that demonstrate a partner is willing to go the extra mile.

The methodologies used in this study rely on coding text into content categories. Caplena.com is an AI-powered platform which automatically codes text with great precision after training by human content experts. Its novel deep-learning-based engine enables fast, inexpensive and accurate analysis of large scale open end surveys or other text sources.

The figure above shows the whole picture of this study. The vertical axis is the frequency that a relationship factor was mentioned, and the horizontal axis shows the derived impact of those factors on relationship satisfaction. The results show the challenge of conventional survey research: namely that humans have difficulty knowing and expressing what drives their behavior. Self-learning AI-based algorithms help find the complex correlations between stated responses and the level of satisfaction.

More details on the applied methodology, the caplena.com text analysis platform and the new generation of Net Promoter Score programs (NPS.AI) will be provided by a series of webinars that codit.co and Success Drivers will host together this fall.

The next webinar takes place on August 28, 11am ET. Free registration over https://goo.gl/2fGoKr

Read here more on NPS.AI

Multi-client study PRICE.AI

By | Allgemein

Test all your prices at scalable costs

Manufacturers and retailers have to manage hundreds or thousands of prices. Established price measurement methods such as conjoint are too expensive on this scale. Simple methods like PSM produce rationally biased results.

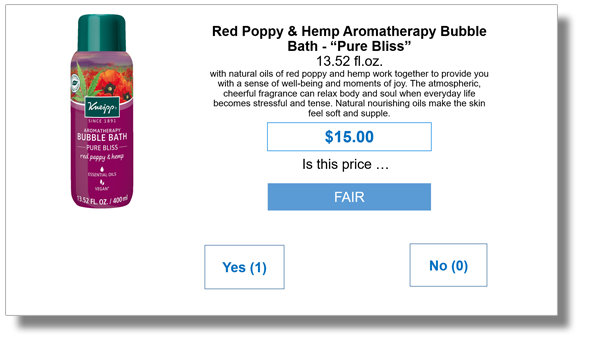
The solution: In a standardized online survey of potential customers, Price.AI uses an “implicit” survey method to measure unconscious willingness to pay. This is the scientifically established way to reveal unconscious associations. We apply this to the price range to be tested (default 7 price points). A 5-minutes questionnaire later, our algorithm calculates a multiple validated price-demand function and the profit-maximizing price range.

The Multi-client-Study: 

  • Starts beginning of June 2018
  • Express your interest until May 17th.
  • Your input: In our Excel template, you write down the product description, the price points to be tested, the name of the product image to be shown and select the screener question belonging to the product.
  • You will receive: Price-sales function in Excel per product. When indicating the product cost of goods sold, we deliver a price-profit function.
  • Participation costs: 500 USD per tested product plus 1.5k setup fee (volume discount scale an request)

For further background information please contact Frank Buckler, PhD. Just send an email to: buckler@success-drivers.com

Evidenced: Which Creative Techniques Drive your In-Market Performance

By | Allgemein

Invitation: We accept inquiries for participation of your brand until Feb 25 2018

For six product categories, our syndicated study ”Creative.AI“ in 2017 has revealed which creative techniques and emotional triggers drive purchase intent – short and long-term.

In 2018 we are expanding this approach by not limiting it to purchase intention anymore. Research shows that intention and purchase are correlated, but– depending on product category, research approach and context – this correlation can be substantially increased.

In this study we show the specific impact of intentions on purchase behavior for your specific product category. We make causal relationships transparent and maximize the power to predict the in-market impact of creatives – even before anything has been produced.

With your participation in this syndicated study you will profit from the following deliverables:

  • You test your commercial with a target group that already resides within the purchase funnel instead of surveying people that will not have a need for the product or service in the near future
  • You determine the short-term and long-term sales impact of creative techniques (e.g. celebrities, spokesperson, brand song, or 100 others), emotional triggers (indulgence, family love or 130 others) and physiological emotions (happiness, surprise, sadness, etc.).
  • You receive insights that will show you which content features of your commercials have which emotional impact on your customers; this will enable you to improve creative and message design

How we proceed

  1. Copy-testing of commercials in an online survey: We simultaneously test a large range of competitive spots in order to cover a large variety of creative techniques. The tested ads will be profiled with an objectivized content analysis.
  2. Purchase intention measured with improved methods; scientifically validated and state-of-the-art
  3. Re-contacting of respondents after exposure and determining their purchases
  4. Driver analysis (self-learning, AI-based) to quantify the causal importance of creative techniques

Costs for participating companies depend on reachability of your target group, the purchase frequency of your product category and the target region. Fees start at $6k per tested commercial.

For product categories with infrequent purchases we will also provide data on information seeking behavior (in addition to purchase behavior).

Schedule: Declare your interest shortly. We finalize agreements until Feb 25, 2018. Field phase is March to April. You get descriptive copytest results in April and final study reports end of May, 2018.

Contact: Frank Buckler, PhD., buckler@success-drivers.com