Category

Allgemein

The Blueprint for Successful Advertising

By | Allgemein

Creativity does not follow rules. Correct. However, if it wants to be successful, it needs clear guide rails – just as the creativity of architects is guided by the laws of statics. But what does actually work – “Celebs?”, “Voice over?”, “Which music?”, “Community or pleasure?”, “Problem or solution?” – There are hundreds of such questions to which we have now clear answers.

CONCRETE GUIDE RAILS FOR SUCCESFUL ADVERTISING? NO CHANCE!

75% of the advertising effectiveness does not depend on the budget or the media plan, but on the ‘quality’ of the creation. However, it remains largely unclear what exactly is needed for good advertising.

The result: Only 16% of the ad spots are actively recalled and only a third of all creations lead to an attractive ROI.

On the other hand, many successful campaigns have an ROI of a factor of 10 or more. Where can you invest your money better than in such advertising? Nowhere, if – and only if one knows the blueprint of successful advertising.

THE SOLUTION: PROFILING OF CREATIVE TACTICS

There are a variety of test methods for advertising. Copy test surveys, eye tracking, EEG measurements, and a lot more. All these methods are good, useful and important.

However, there are two things they fail to do: they just measure the response to advertising, but not the effect of individual design parameters. They collect data which, on their own, do not support any causal inferences. For example, any coke advertisements will tend to perform better in all parameters – regardless of how good the advertisement is by itself.

The now piloted solution combines three modern approaches into one:
1.The copy test survey, which also measures the emotional impact of  advertising.
2. The quantitative content analysis: Experts analyze each ad and encode the creative vehicles (celebrity, humor and 90 others) and emotional triggers (indulgence, family love and 130 others).
3. Determination of the causal contribution to the success of each tactic: Here, self-learning algorithms of artificial intelligence are used to prove what works and what does not.

EUREKA MOMENTS THANKS TO THREE-RATE EXPLANATORY POWER

The success factor analysis makes it possible to measure how valid the established “blueprint for successful advertising” is. Compared to the best models to date, this explains 3.1 times better how advertising works. Dozens of eye-opening findings in our study prove this. Here are three examples:

The study shows that emotions are the key to success. Even rational messages are not processed until emotions are aroused. However, only certain emotions are productive others again extremely destructive.

Furthermore, the study shows that in each product category different basic emotional messages are effective. On top of that, the messages that are usually used in their respective industry are usually not effective – just like the “belonging” message for alcoholic beverages, the “trust” message from financial service providers or the “relief” message for medication.

Also, frequent techniques like celebrities or voice-over generally are not effective. In fact very specific and old tactics are often those, which work wonders.

These and dozens of other findings will fundamentally change advertising in the future.

HOW TO IMPLEMENT THE METHOD

The quickest way to get started is the Quick-Audit, which Success Drivers offers free of charge. Furthermore, the Copytest used in the study is an inexpensive first step. With the help of the blueprint established in the study, concrete areas of improvement are illustrated by means of the Copytest.

In the medium term, it is advisable to carry out own category-specific “deep dive” studies and thus develop your own specific know-how. The use of the sales data of the advertised products makes it possible to accurately predict in the model the sales-increasing effect of an ad.

However, the best research will only bear fruit if it is translated into sound creative strategies, and if the marketing management as well as the creative agency stands fully behind it. For this reason, we have developed specific workshop concepts. Here, we use our database of more than 60,000 tried and tested exemplary spots to illustrate the different varieties of certain basic emotional messages and other creative parameters.

More details about the results can be found in the following video recording of my speech at Esomar’2017:

BrandGrowth.AI: A proven, evidence-based strategy for more growth of your brand

By | Allgemein

BrandGrowth.AI: A proven, evidence-based strategy for more growth of your brand

In recent years neuroscience has provided the scientific proof. The result of human decisions can be detected in the brain already one to seven seconds before it has entered consciousness. Well, 90% of our decisions can be explained by unconscious emotions, attitudes, and instincts. However, most advertisements still focus on the potential product benefit and other USPs. The consequences are far-reaching.

Consumers make thousands of choices every week and are exposed to thousands of advertising contacts. It is neither practical nor relevant for people to process and understand all of them, or even to enter into a “relationship” with a relevant number of brands.
The scientific models developed by Ehrenberg and Bass decades ago are based on a different understanding of consumers – with success. They predict consumer behavior and thus the market structure very precisely. Large empirical studies have confirmed this over the last decades in hundreds of product categories across the different cultures.

Ehrenberg und Bass: A milestone in marketing research

In his book “How Brands Grow”, Byron Sharp – the current director of the Ehrenberg Bass Institute – has outlined on the basis of cross-cutting empirical studies which far-reaching consequences for convenient marketing strategies the new consumer understanding has.

He proves that placing the focus on winning new customers is more effective than binding the existing ones. Coca Cola makes more than 50% of its sales with customers who buy a coke only 2 to 3 times a year. Just about every brand makes a relevant revenue share with a large number of occasional customers – the “long tail”. This opens up an enormous growth potential.

Sharp also empirically proves that positioning on the basis of emotional differentiation is overestimated and he shows that branding is about more fundamental things. It’s about

  • being saliently perceived and anchored in order to enter the choice at the moment of the decision,
  • ensuring that advertising contents are placed in a context by arousing the right emotions and it is about
  • maintaining continuity so that the brand image is strengthened over time rather than diluted.

As a third point, Sharp proves that it is important to keep the brand “available” in all respects in order to exploit the full potential. “Make it Easy to Buy” is the motto. This not only includes the dissemination of CPG products on the market, but also their visibility there or the avoidance of various, in hindsight partly trivial buying obstacles.

BrandGrowth.AI: Success Drivers’ solution for more growth of your brands

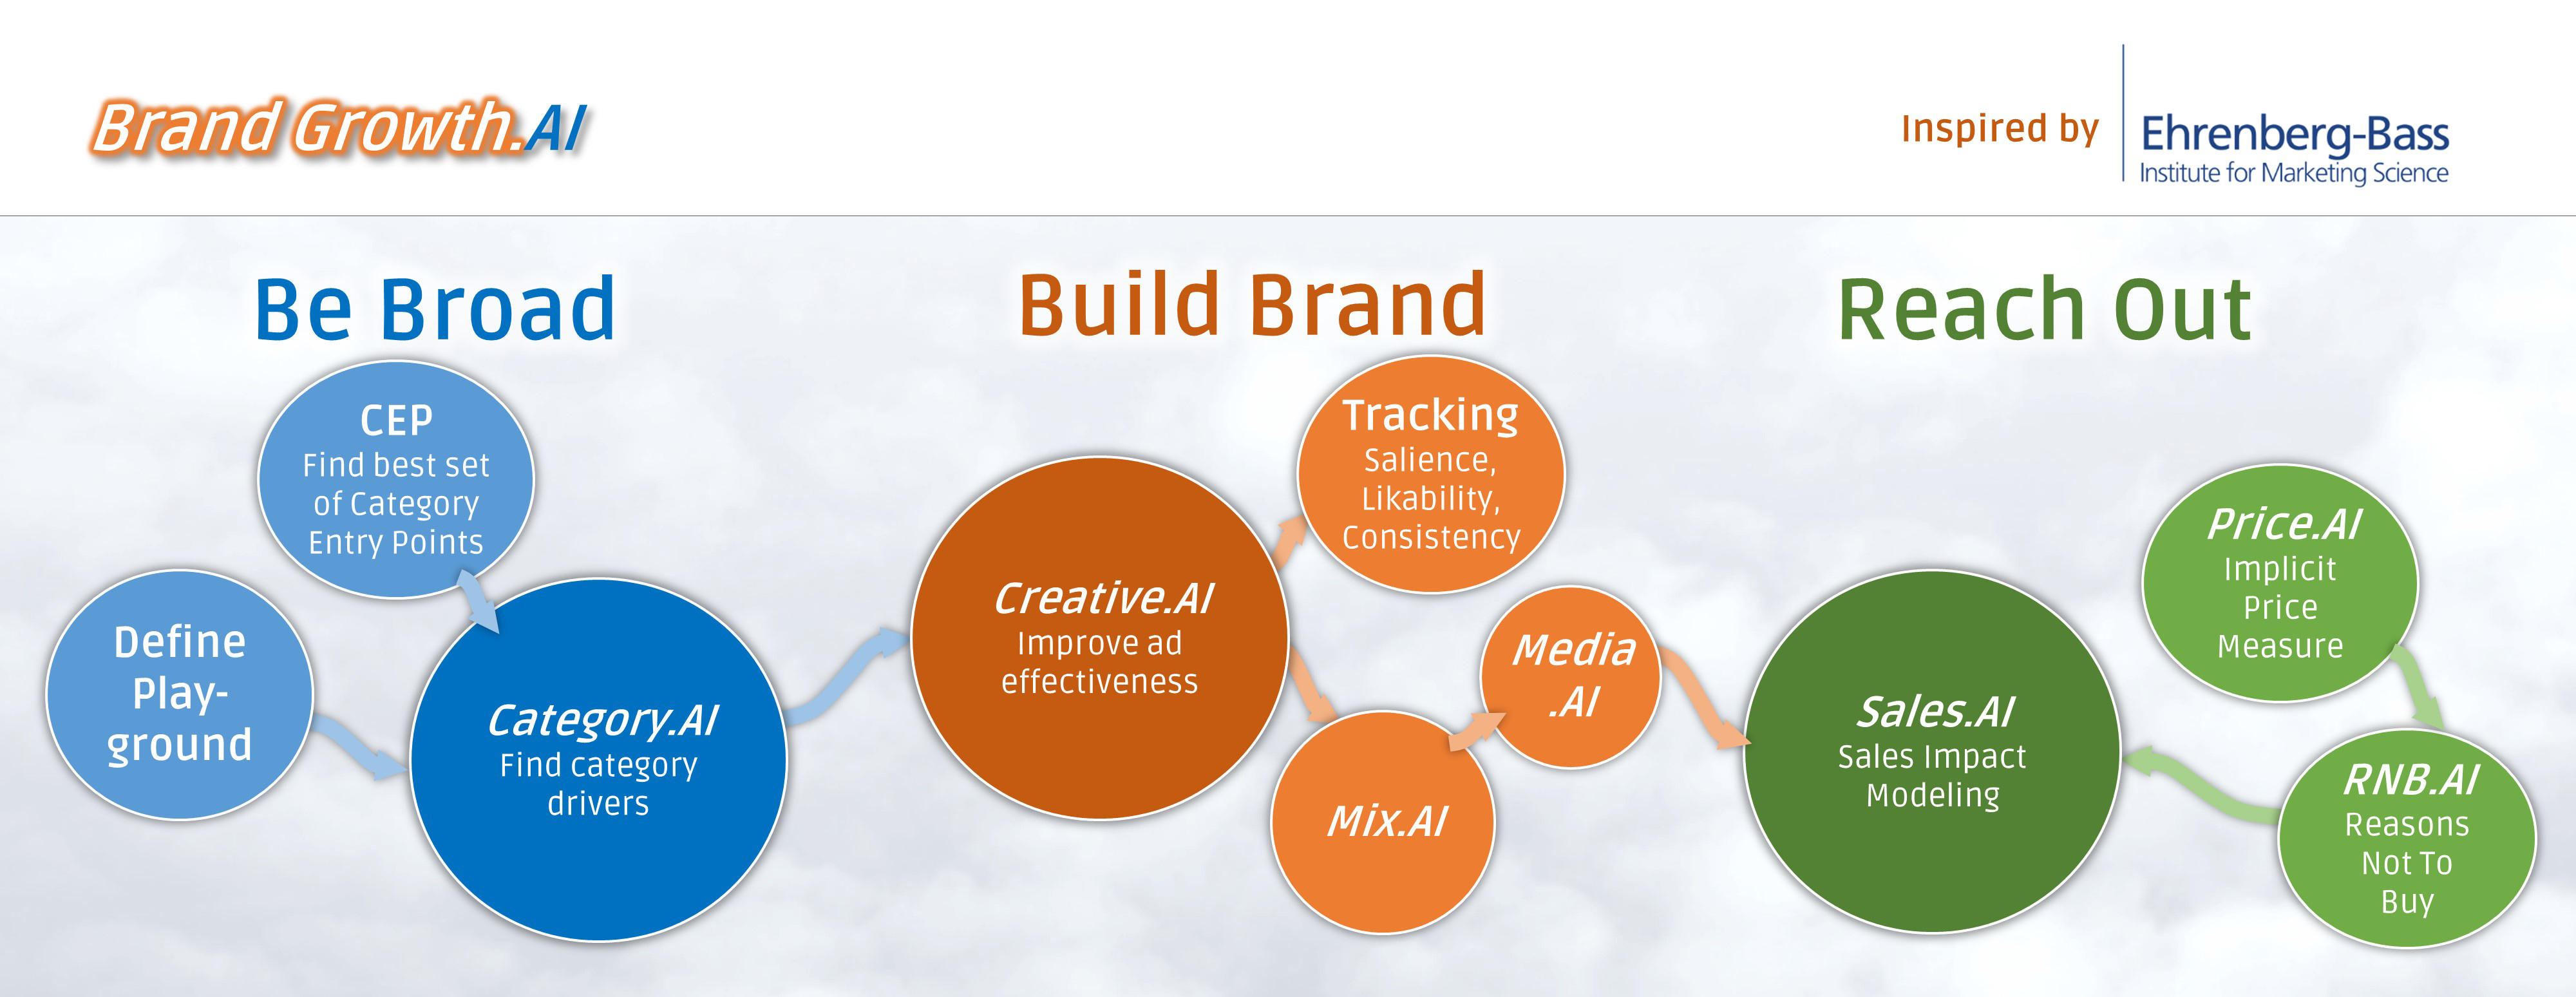
In the growth package “BrandGrowth.AI” we have compiled our patented analytics solution. It includes the key steps that we recommend to all brands in the market to strengthen their position in the long term and generate growth.

1. Be Broad –Exploit as much potential as possible

Step 1 – Define your playground

Is Head & Shoulders a shampoo or a men’s anti-dandruff shampoo? The brand is bought by men and women most of whom in addition have no relevant dandruff problems. With selective targeting, the brand would not be the world’s best-selling shampoo brand. But how do you find the right scope, the appropriate definition of the “playing field”? Exactly for this, there are methods such as the intersection analysis that can help.

If you believe your brand owns a real USP, then this would be an occasion to think about expanding or changing the category understanding. Why? Rational decision-making processes are more likely to be found in the choice of product category and less in the selection of brands.

Step 2 – Find you’re optimal set of Category Entry Points

You pass McDonalds while driving and you still did not had breakfast. If the brand is not associated with breakfast, you’ll drive by without noticing you have missed an option. Did you ever ask yourself why tomato juice is mainly consumed in planes? Flying is (for whatever reason) a central Category Entry Point (CEP) for tomato juice.

Brands grow if they are associated with more relevant CEP’s. We identify qualitatively potential CEP’s, measure the relevance using implicit methods and identify how your brand is already associated with relevant CEP’s.

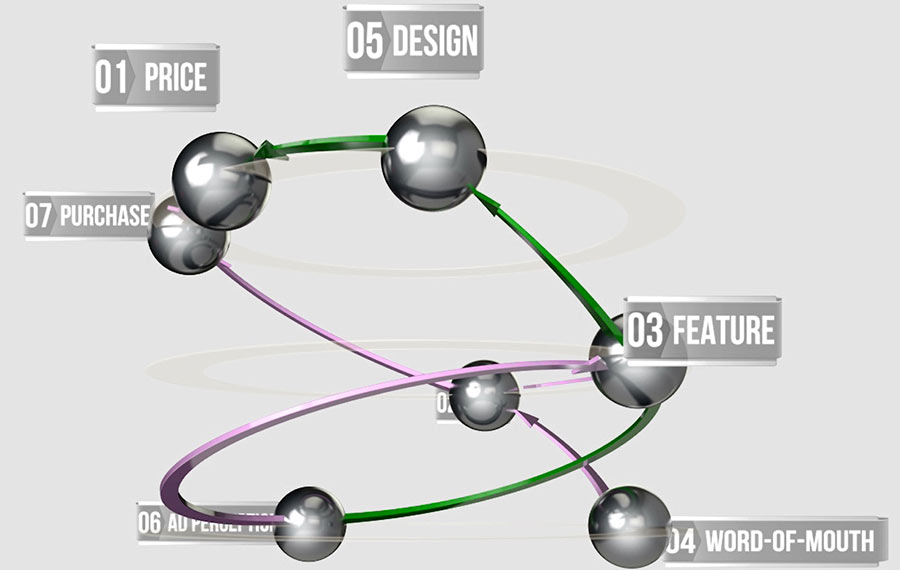
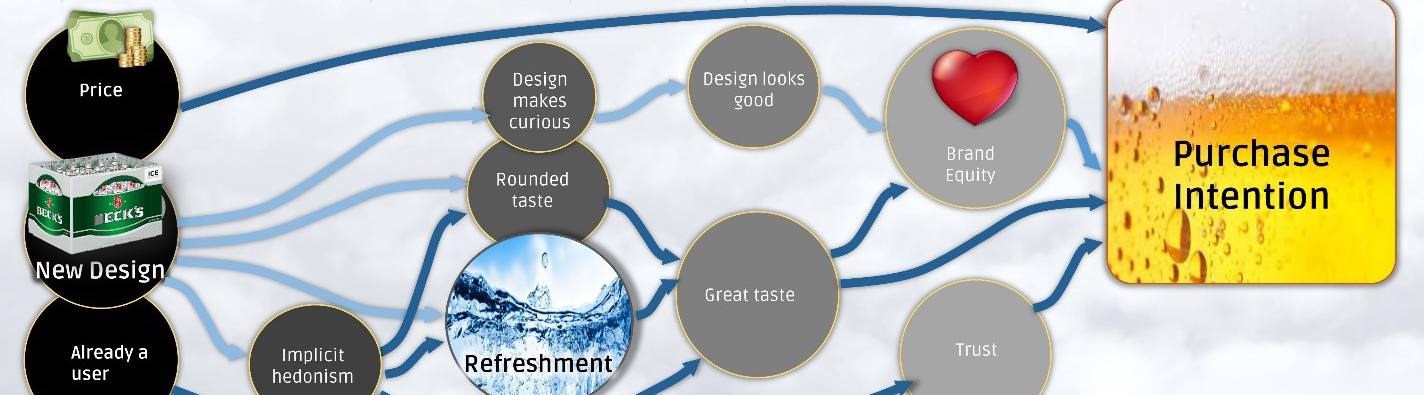
Step 3 – Category.AI – Find your category drivers

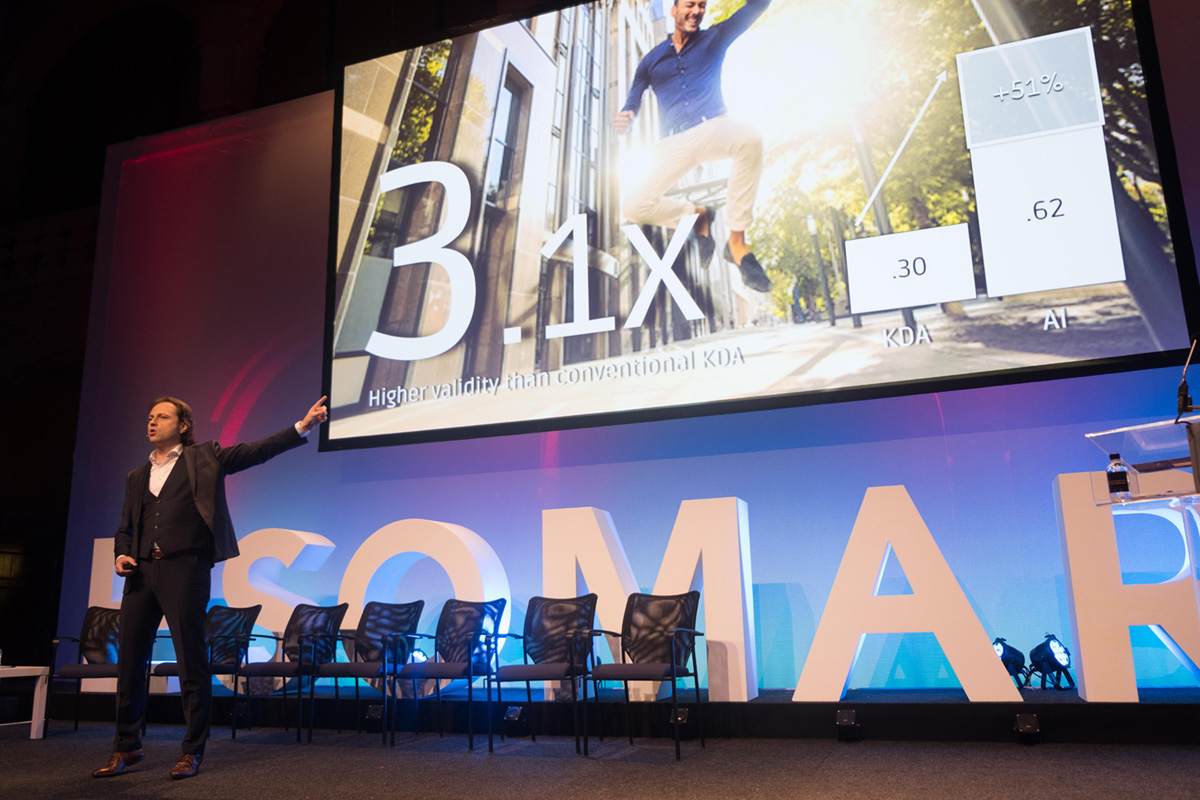
For the buyers of a category, the lowest common denominator needs to be found, which allows for convincing as many buyers as possible. Our AI-based driver analysis covers the central levers of each product category by means of simple brand surveys.

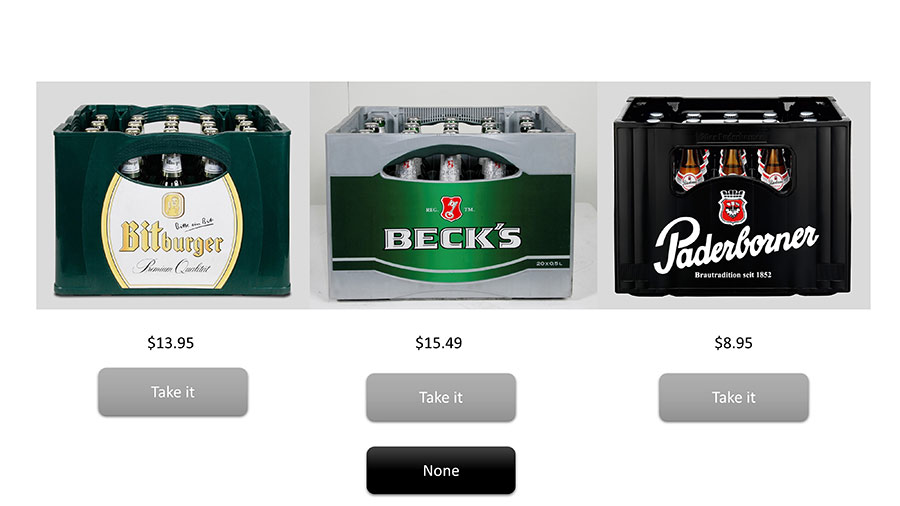
Here we find that the core driver for the beer category is the refreshing experience. We discover that in the skin cleansing category, the fragrance is the central purchasing indicator. We demonstrate that a bank should primarily focus on its expertise in financing and investment.

These core drivers are the lighthouse for your marketing. At times it seems too trivial that a beer refreshes, a shampoo smells good and a bank provides good advice. It is therefore often the rule instead of the exception that brands move too far away from this lighthouse.

This case study, using the example of the SONOS brand, illustrates the procedure.

2. Build Brand – Maximize the “mental availability”

Branding aims to strengthen the mental availability by strengthening memory structures related to brands. This is achieved by the use of unique brand elements (logo, colors, figures, melodies, stories and associations) which are constantly used over years and decades. However, this anchoring can only be achieved if it is possible to involve advertising content emotionally – or when the brand is shown in emotionally involved contexts (keyword sponsoring).

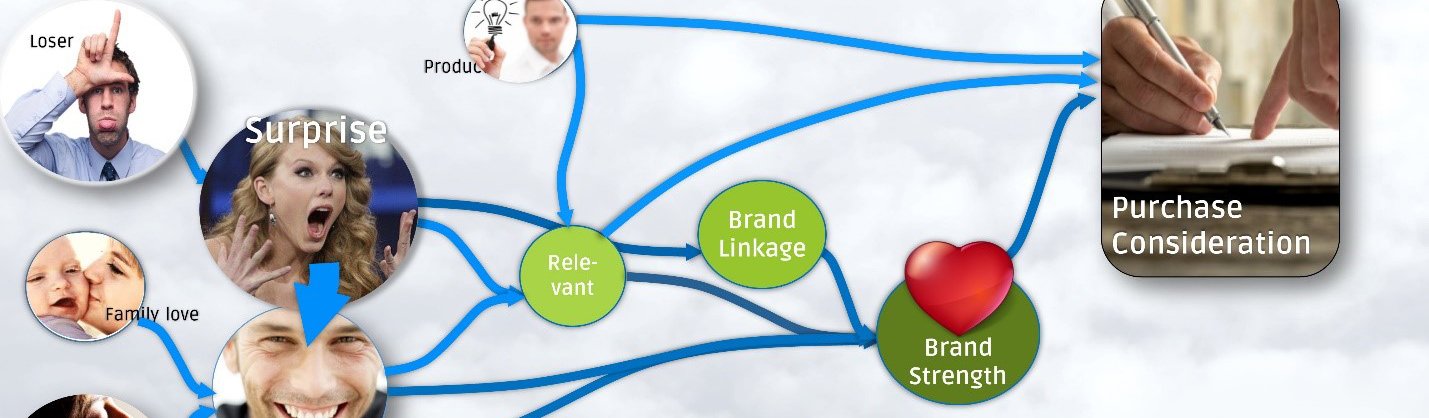
Step 4 – Creative.AI – Identify the DNA of successful advertising:

Our Creative.AI solution is designed to find out which emotional archetypes and creative techniques are capable of involving customers in a positively emotional way and thus cause a deeper anchoring of the brand elements. Find out more about Creative.AI here

Many large-scale studies show that at least 70% of the advertising effect depends on how well it is done. The evidence-based optimization of creative content is therefore of crucial importance. Only when this step has been completed does it make sense to optimize the distribution of marketing budgets more precisely:

Step 5 – Media.AI – Media planning with maximized reach

According to current state of research it is a fact that the first advertising contact has the highest ROI. Repeating contacts are only reasonable if there is no alternative target group available with similar response to the advertising. Byron Sharp showed with great empirical evidence that advertising has greatest impact at light category buyers (long tail), typically not within the “core target group”.

That’s why impactful media planning is less focused on razor-sharp targeting but maximizing reach within the group of potential category buyers. Media.AI samples individual media usage profiles among category buyers and than computes (by leveraging A.I.) those combination of media channels, types and times that maximizes reach with an existing budget.

Step 6 – Mix.AI – Mix modeling in the digital age

Marketing Mix Modeling is an established method. However, it requires an update. In the digital age, channels mutually define each other to a growing extent. A TV spot generates Adword clicks – an indirect effect that must be taken into account. AI-based driver analyzes not only depict this indirect relationship, but also find hidden synergies, i.e. interaction effects between channels. More about our MMM approach.

Step 7 – SLC-Brand Tracker: The 3 central KPIs always in focus

Brand trackers nowadays primarily measure the brand image in order to check whether the brand is still perceived according to definition. However, it is much more crucial to track how salient, “likable” and continuous the brand management is:

  • Salience (brand salience): It measures how many anchor points the brand occupies to be recalled and retrieved at the required time. In order to optimally measure the brand’s salience, a separate measuring instrument must be developed that scans all brand “cues”.
  • Likability: Is the brand associated with positive emotions and with the basic benefit of the category?
  • Continuity: Is the brand communication based on existing memory patterns or  is it diluted by building new ones?

3. Reach out – Maximize the “physical availability”

Under the concept of “physical availability”, we understand that the brand is in the perception field of the consumer when required and meets certain knock-out criteria (for example, desired package size, price category, etc.). The degree of dissemination on the market here is only one of many obvious components.

Step 8 – RNB.AI: Identify the reasons NOT to buy

Brands whose apparent success is “convenience” often have eliminated certain knock-out criteria. Shining examples are PayPal, Google Search, Nintendo Wii or the iPhone. Interestingly, to marketing experts it is by no means obvious in advance what exactly these criteria are. More detailed research is required. We recommend a two-step approach

  1. Qualitative research: depth interviews, focus groups or communities
  2. Quantitative exploration: Our AI-based driver analysis reads from a quantitative survey concluded for this purpose which criteria are actual “show-stoppers”.

The approach has been designed and tested for a current product category on the market as well as for new product concepts.

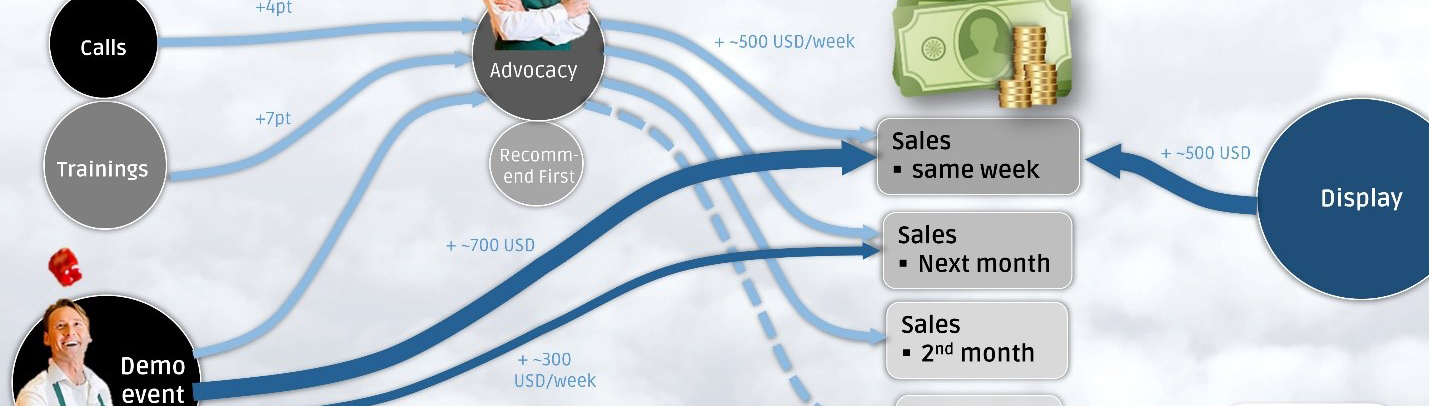
Step 9 – Sales.AI: Maximize the impact force at the POS

The impact force at the POS can be increased by a variety of measures: displays, in-store furniture, demo events, sales training, price promotions, etc. However, their effectiveness is not directly reflected in the data. Thus, some measures have long-term (training) and other short-term (price promotions) effects. Sales.AI establishes a convenient record and evaluates the ROI of these sales promotion activities.

Step 10 – Price.AI: Find price points that are acceptable to the majority and maximize long-term returns

A price point that is too low will jeopardize the long-term “survival” of a product – too high a price reduces the actual availability and prevents the full profit potential from being exhausted. The price is not only the easiest to change marketing parameter it is also known to be the most effective one. Every dollar increase is one dollar profit.

Price.AI is based on an implicit measurement of the price stability and models the causes, conditions and leverage of the willingness to pay. This makes it possible to find and manage optimal long-term price points.

The BrandGrowth.AI Audit – Find out what works for you

BrandGrowth.AI is a collection of tools that are applied at the most important parameters for brand growth. It provides focus, highest validity and transparency in the jungle of methodological possibilities.
We offer new customers a free-of-charge audit workshop in which we will discuss with you what your individuals needs are to be able to move your brand to the next level. With a little bit of luck, it will be the same as with T-Mobile USA, who, 4 years after the implementation of Category.AI., have doubled their market share and today are making record profits.

How T-Mobile Doubled its Market Share through Artificial Intelligence

By | Allgemein

How T-Mobile Doubled its Market Share through Artificial Intelligence

What can you advise a brand that has a qualitatively worse product, operates in a largely commoditized market and has suffered massive losses for years? The way out of the misery reminds of the fantastic stories of Baron Munchhausen, who pulled himself out of the swamp by his own hair.

Our analytical know-how was the decisive basis for an unprecedented success story in which the market share doubled in only 4 years and today profits are at a record high. Read how similar effects will be possible for you as well.

The Brilliant Frontal Attack

The year was 2013. T-Mobile was virtually doomed to die. Years of massive losses lay behind it. But the mother company found no buyer for the unloved daughter. John Legere took over leadership of the company as CEO and was given free rein from the headquarters. Things could hardly get any worse.

His strategy was to move heaven and earth, so that customers would again opt for T-Mobile. He reduced the prices, terminated the contract obligations and threw in top smartphones simply for free. He framed the whole story with a communication story “The Un-Carrier”, in which he celebrated T-Mobile as the Robin Hood of the mobile phone companies.

The customer growth was not long in coming. Yet the question remained: Why do customers come to us? Is it the price, the contract obligation, the smartphone or the emotional attraction of the new positioning? Conventional methods gave contradictory answers. One could get any response by filtering the insights accordingly. Does this sound familiar to you?

Artificial Intelligence in Action

T-Mobile addressed this question to us because the question of why, the question about the central cause of success is our specialty. Conventional correlation and regression analyzes had not been able to provide convincing answers.

We resorted to a nationwide survey of customers and non-customers. Such “brand trackers” are carried out by almost all companies on a regular basis. In these, we measure the willingness to change to T-Mobile, the perception of the brand image, the extent to which the new positioning has already been learned, and, above all, the assessment of the customers and prospective customer regarding the central purchasing criteria such as network quality, price, contract obligation, service or devices.

Still, data is useless if it is not possible to identify the true cause-and-effect relationships from them. Simple correlations only provide spurious correlations and conventional statistical methods are neither able to take into account indirect cause-effect relationships nor to correctly represent the unknown facets of the relationships (nonlinearities and moderation effects).

We carried out a universal structural modeling – a causal machine learning procedure. It is distinguished by three captivating properties:

  1. Measures causality not correlations, and thus avoids the classic pseudo insights.
  2. Reveals indirect effects and thus, in contrast to classical driver analyzes and regression approaches, is able to estimate the true overall effect.
  3. Is self-learning and thus models previously unknown nonlinearities and interactions.

Importance of the Findings: Immense

The findings of the analysis were manifold. The most important and at the same time most surprising insight was this:

Neither price contract obligation nor top equipment has a massive direct impact on the purchase. It was the “Robin Hood” positioning that attracted the customers. The pricing, lack of contract obligation or equipment extras were merely levers that fuelled the perception of this positioning. Findings that remained hidden with conventional analyzes.

Instead of preserving the growth by fighting yet another price war, we recommended to constructively strike out new paths, which substantiate the positioning. Exactly this was the path of the company in the coming years. T-Mobile offered, for example, customers of the competitors to take over the fee in case of premature termination. Or the flat rate was extended to calls abroad.

“Success Drivers provided us the confidence to advise our business partners on the most effective and efficient means for sustaining our brand momentum.” David Feick, Ph.D. Director Consumer Insights, T-Mobile USA

Learnings

The case study shows the crucial importance of a precise understanding of what motivates the customers in their market to act as they do.

Industry knowledge of experts is a necessary but not sufficient prerequisite, because the variety of simultaneously acting cause-and-effect relationships cannot be deciphered by a human being manually. Causal artificial intelligence can help, as the example shows impressively.

The example also shows how conventional statistics in such real-world questions often are not sufficient. Success factors influence each other (indirect effects), change their meaning depending on the context (interaction) and depending on their occurrence (non-linearity). Artificial Intelligence and Machine learning algorithms can support management in extracting valuable information from the ocean of data.

Data quality cleaning using machine learning

By | Allgemein

Data quality cleaning using machine learning

New, more effective ways to avoid bad response effects, sampling bias and fluctuating KPIs

Some respondents click rapidly through the questionnaire, some erratically. The random sampling in a survey is often a far cry from a chance selection. Excessive quota systems increase the problem instead of solving it. Internal customers often ask themselves why an NPS (or other KPIs) has decreased or increased and can find no reasonable answer. Misgivings regarding the data quality can destroy the trust in an entire study. Luckily, there are new, effective ways to counter this.

The bad response effects example

Many market researchers have developed their own “practical” rules to counteract this. Overly short survey times or too many affirmations lead to the exclusion of a respondent. Occasionally, test questions are introduced to check whether a respondent is “paying attention”.

The problem is: what exactly is the right survey time that should be used to exclude respondents? Which rate of agreement can be used to differentiate a fan from a dishonest respondent? What exactly does the test question say about the survey behavior of the person?

The answer to this question is not known and can hardly be answered from data using typical means.

Self-learning analysis methods, also known by buzzword “machine learning,” offer the chance to learn of complex relationships between indicators and their effects based on data.

Bad response indicators include, for instance, the length of the interview, the response to a trick/consistency question, the number of identical responses in a row, and many more. The trick no longer tries to assume the meaning (= influence) of these indicators for the results (arbitrarily) but rather uses the data to discern the causal influence. This is possible with cause-effect analyses based on machine learning (especially NEUSREL). The analysis yields the following results. The graph shows that customer satisfaction is extremely high for interview lengths under a certain number of minutes (the scale is normalized to 100 here).

diagrammsatisfaction_2

This makes it possible for us to derive reasonable decision rules. Below a time of 20 (normalized) the satisfaction is obviously massively biased. On the right side, you will find a scatter plot containing the same variables, and you see a very different relationship there. Why? It could be the case that the fast respondents are younger people who are per se less satisfied with the provider. Machine learning delivers causal, corrected insights instead of the typical spurious correlations.

If the data is used for a driver analysis, it is recommended to not exclude the suspicious cases at all. Because the bad responses are described well by the indicator variables, a driver analysis based on machine learning (especially NEUSREL) simply filters out the bad response effects. The sorting out of cases would introduce a new but unknown selection bias to data.

The sampling bias example

Distortions in random sampling can occur, for example, as a result of a willingness to participate among the subjects that does not differ randomly. By measuring indicators of this willingness to participate, such as age, sex, income or a trait such as the “need to communicate,” machine-learning-based cause-effect analyses can determine the relation between indicator and response behavior. If there are too many seniors in your sample, for instance, you then know how this will distort each question and consequently you can correct this effect.

For the use of data in driver analyses, it is sufficient to make good indicators part of the driver model, because it automatically subtracts out all bias effects. However, this is possible only for driver analyses based on machine learning (especially NEUSREL). In this manner, an overly strong quota system, which itself creates new quota-related biases, can be avoided.

p.s. More on NEUSREL and Universal Structural Modeling here2

Lowering returns quotas: breakthrough via causal analysis.

By | Allgemein

How leading returns researcher Professor Walsh discovered effective levers to lower the returns quota via causal analysis.

The extremely high returns rates in e-commerce are an unsolved problem – a problem that represents a challenge to managers due to the tight margins in online retailing. Traditional BI analysis results very often turned out to be misleading in the past. The reason is known as “spurious correlation”.

Success Drivers  therefore identified, for example, that horizontal striped clothing was sent back less often. A classic spurious correlation: horizontal stripes are found particularly on cheap products, for which the returns rate is generally lower. Under otherwise similar circumstances, horizontal striped products are sent back MORE not less. This is a finding that can only be discovered via causal analysis.

The returns whisperer

For this very reason, Professor Walsh from the University of Jena has been involved in causal analysis with his team of researchers. His various studies provide many new insights into what drives product returns.

In a study, which appeared in the Harvard Business Manager, he and his co-invetigator found that the use of penalties and obstacles does not pay off in the long run. Their study showed a clear strategic path: return rates can be reduced by providing customers with relevant product-related information and making the buying process as hassle-free as possible. Virtual try-ons, avatars and specific product evaluations from peers are very helpful in this respect. The latter is a factor with very high ROI as the investment is low.

Self learning causal analytics covers up

With the current study the research team around Gianfranco Walsh were also able to identify a key driver of customer returns. Using consumer survey data and causal analysis, they found that the customer-related reputation of an online retailer alone has a significant effect on the return rates.

This reputation is determined by the following components: customer-orientation, being a good employer, being financially sound, perceived product quality and social responsibility. Although this measure may seem very abstract, the new causal model enables very precise measurement of the effect of bad press and to quantify the effects on the margin.

“There are also many company-specific returns levers. They may be identified most successfully via self-learning causal analysis – as enabled by the NEUSREL software”, Walsh recommends.

p.s. More on NEUSREL and Universal Structural Modeling here.

Conjoint Analysis: Price & Product Optimization Using Holistic Conjoint Analysis

By | Allgemein

Conjoint Analysis: Price & Product Optimization Using Holistic Conjoint Analysis

It is an open secret in the industry. Conjoint Analysis Software often delivers strange results forcing analysts to tweak datasets or analytic parameters so that results will have some face validly. Only this is not a procedure that produces correct results. The phenomenon is a clear indicator that something is still wrong with today’s conjoint analysis approaches.

The challenge with Conjoint Analysis

Many advances to Conjoint Analysis approaches have been developed. There is ACA (Advanced Conjoint Analysis enabling for partial feature profiles), CBC (Choice Based Conjoint switching from preference to choice) or CSC (Constant Sum Conjoint enabling for a distributed choice).

The basic principle is to conduct several choice experiments by manipulating causes (i.e. features). Due to practical reasons, it is not possible to assess all possible feature combinations at one respondent. This is where the issue evolves. That is why the choice of feature combinations per person is randomized. This would work if samples were large enough, but they rarely are in real life studies!

An example clarifies

Imagine there is a study where actual consumers of a food brand are more likely to choose the brand – simply because they have already tried it. But this feature “have already tried” is not part of the conjoint experiment. If features are randomized, there will be features or feature combinations with significantly higher ratios of persons who have already tried the product.

Since they are much more likely to buy, conjoint analysis will “think” those features or feature combinations must be important. The problem is not solvable by quotation nor by other measures in advance because normaly we donÂŽt know every “disturbing factor” in advance.

Why a solution of the Conjoint Analysis dilemma would be so valuable

If we could consider all the biasing factors of a conjoint, market researchers would enjoy several advantages:

  • First and foremost, it would very much increase the trust and confidence in the validity of results. You can be much more confident that derived recommendations will work.
  • An analysis with all relevant factors will enable a holistic view of the decision process. It will not just focus on the choice decision but will also quantify the impact of product features and prices towards brand reputation, brand awareness, consideration, loyalty or recommendation.
  • Finally, such a study would be a single source for multiple information needs. It may serve for brand positioning, segmentation and customer journey questions.

The powerful solution: Holistic Conjoint Analysis

For a holistic conjoint analysis approach we need to collect several pieces of information:

  • Several choice tasks per respondent with randomized feature profiles.
  • Attitudes and image of brand.
  • Data about the outcomes of interest, such as purchase intention, willingness to inform, brand consideration
  • Data about the respondents such as demographics, their situation, and their history. Are they already customers? Are they bargain seekers? Are they familiar with the costs? All those items that might have an impact on their desired outcomes.

The ultimate question is ‘how do we identify which changes would improve the outcome?’ It is a challenge to conventional methods as they are built to fit parameters of a known model.

What is needed is a method that builds a prior unknown model in light of data, a model that incorporates indirect causal effects and does not neglect nonlinearity or interaction of those unknown relationships. This is exactly the strength of the Universal Structure Modeling approach that is performed by the NEUSRELTM Software.

The good news: Holistic Conjoint Analysis is proven, reliable, tried and tested

We compared dozens of studies on the validity of Holistic vs. Conventional Conjoint and found a validity lift of 25 to 85% in explanation power. Results show typically higher face validity and give seamless recommendation where pricing and product configuration naturally fit to positioning, segmentation and marketing strategy advice, as it is derived from one single data source and one single causal model.

p.s. More on NEUSREL and Universal Structural Modeling here.

Causal Analysis – the better Key Driver Analysis

By | Allgemein

Causal Analysis – the better Key Driver Analysis 

Marketers and market researchers who are hoping to find the most effective actions in data are confronted with dozens of statistical methods.

At some point someone started to rename regression-based techniques as “key driver analysis” in order make it more obvious what they do – figuring out what drives success. However this has not been ‘state-of-the art’ for decades. Companies can prevent expensive mistakes by switching from Key Driver Analysis towards Causal Analysis. Read Why!

The challenge with Key Driver Analysis

Key Driver Analysis has been a major step, helping to guide companies away from spurious correlations and dangerous mistakes. In fact, the term mainly describes regression analysis or similar econometric techniques and comes with its limitations.

Inflexible

Regression techniques estimate parameters of a model which represents the impact of certain factors towards an outcome. Within this model, it is assumed that factors are independent. This means that the parameter is always the same no matter what the situation.

E.g. a bottle of water leads to a certain growth of a tree, no matter how much water it already had and whether or not the tree gets enough sun.As the example shows, these assumptions can be very unrealistic. The techniques are not able to adopt assumptions to data and mostly don’t even consider the nonlinear nature of reality.

Only direct Effects

On top of this, regression techniques live in a simple world: factors influence outcomes – full stop. When a TV campaign drives Google Adword Views and those clicks then drive sales, a regression method would give the “TV factor” a small impact parameter because with Google Adwords  can perfectly explain sales.

In most real life cases, factors influence each other, just as TV drives Adwords. If you do not consider this, you are not measuring the full impact but only the direct impact.

Key Driver Analysis is simply outdated. UNILEVER first applied it in the 1920’s. It has been around for nearly a century! Companies need a methodologic upgrade to be able to compete in the 21st century.

Why a solution of Key Driver Analysis’ challenges would be so valuable

If we could only quantify the full, and not just the direct, impact, if we could model data with a self-learning system that finds realistic but unknown features such as saturation effect or moderating factors
 we would be able to understand much more realistically what drives success or why customers choose a brand.

More importantly: We would no longer be forced to impose unrealistic assumptions or badly founded hypotheses. We would have more effective recommendations and sales and marketing actions. Increased advertising effectiveness will help save millions of marketing dollars.

The powerful solution: Advanced Causal Analysis

The roots of causal analysis are a hundred years old as well. It all started with experimental test designs. As well as the fact that many things in business are much too expensive to test, most real life experiments face another issue:

there are other drivers of outcome that cannot be perfectly controlled (e.g. with a perfectly randomized sample). That is why a kind of “Key Driver Analysis” is needed to quantify the impact of factors including the experimental action.

The classic causal analysis

In the 1960s and 70s, regression had been extended to path modeling techniques (Structure Equation Modeling SEM, Partial Least Squares PLS) which are modeling not just direct, but the full effect of causes.

Later in the 1990s, Baysian nets (or Direct Acyclic Graphs) had been developed which, on top of SEM and PLS, can (in simple networks) identify the causal direction between variables out of data.

The age of Machine Learning

All those methods have a common limitation: they are not self-learning systems, as researchers are forced to assume a fixed model – most of the time, they also need to assume linearity and independents of factors (remember the tree example!).

The Universal Structure Modeling approach implemented in the NEUSREL software changed that in 2008. As conventional causal analysis requires making assumptions that nobody can justify in a business context, USM is a true breakthrough for practical applications.

The good news: Advanced Causal Analysis is proven, reliable, tried and tested

Since 2008, there have been hundreds of business projects conducted with the help of Advanced Causal Analysis, Universal Structure Modeling and NEUSREL. Many reputed scientists have approved the methodology, dozens of papers have been published and highly reputed brands such as Audi, Deutsche Bank, L’OrĂ©al, P&G, Unilever and many more are leveraging these techniques.

These companies understand up to 300 percent better why customers do what they do. They gain insight that was previously unknown. They explore nonlinearities and discover saturation effects and optimas in their data. They learn how factors and conditions interact and how target groups naturally divide into segments. They learn it without knowing or hypothesizing about it beforehand. This enables these companies to step on a learning curve never seen before.

Copy Testing: How Copy-Testing based on Causal Analysis Leverages Advertising Effectiveness

By | Allgemein

Dozens of studies have been shown that about 70% of advertising impacts cannot be reasoned by how much you spend nor which media mix you have chosen. Rather it is all about crafting an effective creative. But how do we craft an effective advertisement? It is only about 30% art but 70% hard science. This article highlights a proven Copy-Test-based method that ensures creatives that drive Advertising Effectiveness.

The Challenge with Copy Testing

Copy testing of advertisements is a common practice. Still the majority of campaigns don’t meet expectations. What’s wrong? Many interesting research methods have been added to the copy test toolbox in recent years. Eye tracking, skin resistance checks, Neuromarketing with EEG and fMRT measurement, facial emotion coding and Implicit Reaction Testing (IRT) are all powerful methods to detect to what target customer might think and feel about an ad.

But something is missing here

But something is missing: When trying to interpret one of those measurements you assume that you know how this measure relates to the outcomes you tries to influence. This is not the case. There is no single measure that will give success. Furthermore, how components interact with each other might be different per segment, product or situation.

Advertising can be stimulating but there are products where this characteristic is false. So far all surveys are built on the assumption how the measures are connected with the actual target.

Why a solution of the Copy Testing dilemma would be so valuable

If we could decode the hidden formula that enables us to predict outcomes like purchase intention or brand consideration using copy test data, we would be able to optimize the creative in a way that outcomes are maximized.

We would be able to write an individual manual of do’s and don’t’s for every brand on how to craft advertising. Such a manual would be our crash barrier on the creative road of advertising effectiveness.

The powerful solution: Copy Testing based on Causal Analysis

In a model-based copy testing approach, we need collect several information during a copy test:

  • Data about the direct impression of a copy test – newer measurement approaches like IRT and facial coding can play a vital role here.
  • Data about how the direct impression changes attitudes towards the brand and how it increases recall and recognition of the ad.
  • Data about the outcomes of interest, such as purchase intention, willingness to inform, brand consideration
  • Data about the respondent like demographics, their situation and history. Are they already customers? Are they a bargain seekers? Do they know prices well? All those items that might have impact on their desired outcomes.

The ultimate question is: how do we identify which changes would improve outcomes? It is a challenge to conventional methods as they are built to fit parameters of a known model.

What is needed is a method that builds a prior unknown model in the light a data, a model that incorporates indirect causal effects and do not neglect nonlinearity and interaction of those unknown relationships. This is exactly the strength of the Universal Structure Modeling approach that is performed by the NEUSRELTM Software.

The good news: Copy Testing based on Causal Analysis is proven, reliable, tried-and-tested

Results of model-based copy-testing has proven to be eye-opening of marketers and gives an unbiased rigorous guidance:  A recent study has looked at a TV spot of a beverage. The spot made a great impression; everyone liked it, only it did not do anything with consumers. We found that the spot was evoking nonproductive emotions and needed to switch from balance to stimulating emotions.

We found that the spot missed brand anchoring during the advertisement and especially at its end to leverage recall. The optimized spot broke all records and has become the best performing advertisement in the brands in history.

Some say, similar recommendation could have been produced by alternative approached. This big and fundamental difference to any other approach is: We know and have statistically proven that our recommendations are the main levers to maximizing market outcomes. Are other approaches able of the same? We replace “hope” with “knowing” with our selflearning causal analysis.

p.s. More on NEUSREL and Universal Structural Modeling here.

Case Study “Predictive Customer Management” – How Analytics Brings Customer Value, Needs-Segments and Campaign Effectiveness in One Go.

By | Allgemein

Customer Lifetime Value:

An automobile manufacturer encountered the Pareto phenomenon: A small number of the customers are responsible for a large part of the earnings. In practice, it is often not easy at all to be able to recognize what a customer possesses in terms of future value. On top of this question arises how to capture this value. To find an answer you need to think through the whole process of marketing and sales to its logical end. This is exactly what the automobile manufacturer did.

Step 1: In the rearview mirror, you don’t see the upcoming curve: a future-oriented calculation of customer value

Customer-value-oriented customer management is only in its rudimentary stages among automobile manufacturers. Sure, there are corporate customers and there are customers who buy the expensive types of cars.

But what will they buy in the future? How loyal are they to the brands and to the authorized dealers? How probable is it that their next car will be a new car? How much business will be a result of personal recommendations? How much business in service and accessories will the customer trigger? These are central questions to which, up until today, there aren’t any satisfactory answers
no: weren’t!

A research panel of customers delivered the basis for the data: customer profile data, personal car purchases, precise quarterly service expenditures. An additional survey among this panel delivered the information necessary to understand the sales triggered by personal recommendations and to also understand sales expectations over the long-term.

Predictive Analytics (here NEUSREL) delivers the mathematical formulas that can calculate, from customer profiles, the diverse, future revenues to be expected. The result: a forward-looking customer value for every customer, which is calculated based on a small set of variables from that customer.

Step 2: What to do with the valuable customers? Derive segment-oriented support concepts from the data.

“What to do?” The customer value tells you how much value can be “gambled away” when you don’t pay attention. It doesn’t tell you what you can do in order to retain the value or increase it. Here is where Predictive Analytics can help too. Because approaches like NEUSREL also deliver the importance of the variables. And these tells you what the driving force of substantial customer value is.

The automobile manufacturer found out, for example, that aficionados of high performance cars not only invest significantly more today and in the future in production, but also most notably in service. A substantial maintenance division that takes care of high performance cars was born.

Furthermore, the company found out that brand loyalty and trust explained almost half of the customer’s value. The segment of the emotionally uncommitted provides a segment that can be excited by measures tailored to individual customers. Their affiliation can be tested with just two “killer questions.”


Step 3: Does the customer respond to my actions? More effective guidance through prognostic Action Scores.

It is a decisive step when realizing which buttons you can push on a target customer.  Nevertheless, it can happen that the chosen measures don’t take effect. Perhaps because the person, per se, doesn’t read any emails or advertising letters or maybe isn’t receptive to any discount offers.

What you need is an assessment of whether the call, the letter or, for example, the discount offer will actually evoke a positive reaction. In this way, you can avoid having your marketing and sales investments end up in your customer’s “spam folder” and their effect going up in smoke. You don’t want to run the risk of putting your customers off.

How does that work? The targeting, with the help of Predictive Analytics, is a practice that has already been successfully used in direct mailing for over 20 years. On the basis of customer characteristics and customer reactions from the past, an Action Score can be calculated, which provides a probability of a customer’s reaction to a certain measure. With the help of Action Scores, the automobile manufacturer increased the effect of the measures taken by 84% – with the same investment.

Step 4: Change is the only constant: the necessity of a control process

What about when the planned measures are new and therefore there aren’t any empirical values available? Then you need a pilot phase for these measures. For this, customers will be addressed randomly. After a few weeks, a Predictive Model can be built and the measures can be efficiently guided based on the Action Scores.

The value of a customer will also change over time, just like their needs and the products of your company. That’s why the automobile manufacturer decided to conceive the issue as a control process. The customer value formulas are regularly calculated anew. Different than the conventional segmentation approach, the needs segments are also regularly reexamined and, as necessary, adjusted and brought to life with Action Scores.

p.s. More on NEUSREL and Universal Structural Modeling here.

Getting More from the Brand Tracker: The SONOS Case.

By | Allgemein

Most companies have one. A regular measuring instrument to assess the brand’s status quo. But more questions than answers are often thrown up by the large number of facts measured. How can we enhance brands and increase sales? How should positioning be sharpened up, how should be make communication between touchpoints or segments different from each other? The SONOS Case shows us.

SONOS is a home audio brand that has established the new multi-room audio category with its active Wi-Fi speakers connected to the internet. Until very recently, there was only one maxim in SONOS’s marketing: Awareness at any price – retailers will do the rest. The advertising was as expected– shrill and loud.

Here is an example:

Global market research set itself the task of getting to the bottom of the brand drivers. Conventional driver analyses threw up questions, did little to explain the variance in customer behaviour and were not very plausible in their restrictive assumption. SONOS therefore approached Success Drivers. We used the available data to build up a Universal Structural Model (USM). The results were eye-opening.

It All Depends on the Method

Comparison with a correlation analysis showed, for example, that a positive evaluation of Customer Services has a strong correlation with the intention to purchase – however, USM shows that service is not the cause. Consumer who already are already customers tend to assess not only the service more positively but also have higher likelihood to purchase even more.

Comparison with a conventional driver analysis (regression) shows that an association of the brand as a “Leadership Personality” directly and negatively reduces the intention to purchase, but the same driver increases identification with the brand. Since the latter has a great influence on the intention to purchase, “Leadership Personality” is therefore not negative in the overall effect. This is a finding that only path analytical approaches would reveal.

Comparison with conventional path analyses shows that a universal modelling approach models non-linear and interactive connections and, in the case of SONOS, is 60% better at explaining why customers buy. In particular, it because obvious that a perceived “Relax” emotion was barely significant in the linear model, but was extremely important in the non-linear model.

If the brand is seen as hardly relaxed instead of moderately relaxed, consideration and intention to purchase fall dramatically. Moreover, in certain subgroups a high level of relaxed feeling was a genuine sales booster – in methodical terms we call this phenomenon an interaction: drivers can have different significances and importance in various contexts or segments.

Key Insights are Taking Effect

In conclusion, SONOS gained so many insights that completely turned the marketing around. We noted that Paid and Earned Media need completely different communication as opposed to Owned Media or at the POS.

We discovered that SONOS was somewhat neglecting the basic lever of “Sound” as a category in its communication. A new Premium Speaker has been developed and target customers are now seeing much better that the unique SONOS features (multi-room, software updates, etc.) are the reason for a unique sound experience. Every creation has been optimized so that there is always a relaxing feel. See for yourself: